

How to Use Moving Averages to Identify the Trend (Slope, Stack & Position)
Moving Averages Identify Trend
The one job a moving average does well
A moving average does not predict anything. It has no forecasting power, no leading edge, and no opinion about tomorrow. What it does is take a noisy price series and hand you back a smoothed line that tells you what price has been doing — and it does that job better than your eyes do.
That is worth saying plainly, because most of the trouble traders get into with moving averages comes from asking them to do something else. StockCharts puts it about as clearly as it can be put: <cite index=”2-1″>a moving average doesn’t predict price direction — it defines the current direction, and it lags because it is built from past prices</cite>. Lag is not a defect you can engineer away. Lag is the price of smoothing. Accept it and the tool becomes useful; fight it and you end up with a chart full of fast averages that whip you around in every range.
This article is about that one job: using moving averages to answer the question what is the trend, right now, on the timeframe I am trading? If you have not yet read the Moving Averages pillar guide, start there for the overview. If you are still deciding which type of average to plot, the companion piece on SMA vs EMA vs WMA covers the calculation differences and when each one is worth using.
Moving Averages Identify Trend – Four readings, one picture
There are four separate pieces of information on a chart with moving averages on it. Most traders read one of them and stop. Read all four and you get a far more honest picture.
1. Where price sits relative to the average
The simplest reading, and the one everybody starts with. Price above the average, the average is acting as a floor on pullbacks: buyers are in control over that lookback window. Price below it, the average caps rallies: sellers are.
What matters is not the single close but the behaviour around the line. In a real uptrend, pullbacks into the average are bought and the reaction is quick. In a failing uptrend, price sits on the average, loses it, gets it back weakly, loses it again. That deterioration usually shows up before the average itself rolls over. How price interacts with the line is a subject in its own right — see moving averages as dynamic support and resistance.
2. The slope of the average
This is the reading most people skip, and it is the most informative of the four.
An average can be rising, flat, or falling, and that tells you something different from where price is standing. Price above a flat 50-day average is a range, not an uptrend. Price above a rising 50-day is an uptrend. The two look similar in a screenshot and behave completely differently in a trade.
A workable definition: the average is rising if its value today is above its value n bars ago, where n is roughly a quarter of the lookback. For a 50-period average, compare today’s value to ten bars back. That small rule turns a subjective “does that look like it’s going up” into something you can test and, if you want, code.
3. The stacking order of several averages
Plot a short, a medium and a long average — 20, 50 and 200 is the classic set — and the order they sit in summarises the whole trend structure at a glance:
- 20 above 50 above 200, all rising, price on top: a clean, mature uptrend.
- 20 below 50 below 200, all falling, price beneath: a clean downtrend.
- Any tangle of the three: no trend worth trading directionally.
The tangle is the useful signal. When averages of different lengths cross back and forth over each other, short-term and long-term participants are paying roughly the same price. That is the definition of a balanced market, and it is exactly where trend-following rules bleed. Traders who like this reading in more granular form use a moving average ribbon — eight or ten averages instead of three, where expansion and contraction of the whole band becomes the signal.
4. The separation between price and the average
Distance is a strain gauge. In a trend, price and its average keep a fairly consistent spread. When price accelerates far away from the average — well beyond its usual distance — the move is stretched, and it resolves either by pulling back or by going sideways until the average catches up.
This is not a reversal signal and should never be traded as one. Plenty of the strongest trends in history spent weeks extended above the 50-day. It is a sizing and entry signal: chasing a market that is three times its normal distance from its average is how you buy the last third of a leg. Moving average envelopes formalise this by drawing fixed percentage bands around the average, and Bollinger Bands do it with standard deviation instead of a fixed percentage.
Which lookbacks to use
There is nothing magic about 20, 50 or 200. They matter because enough people watch them that behaviour clusters around them — a self-fulfilling element that is real whether or not you approve of it. What actually determines a good lookback is the horizon of the trade you intend to hold.
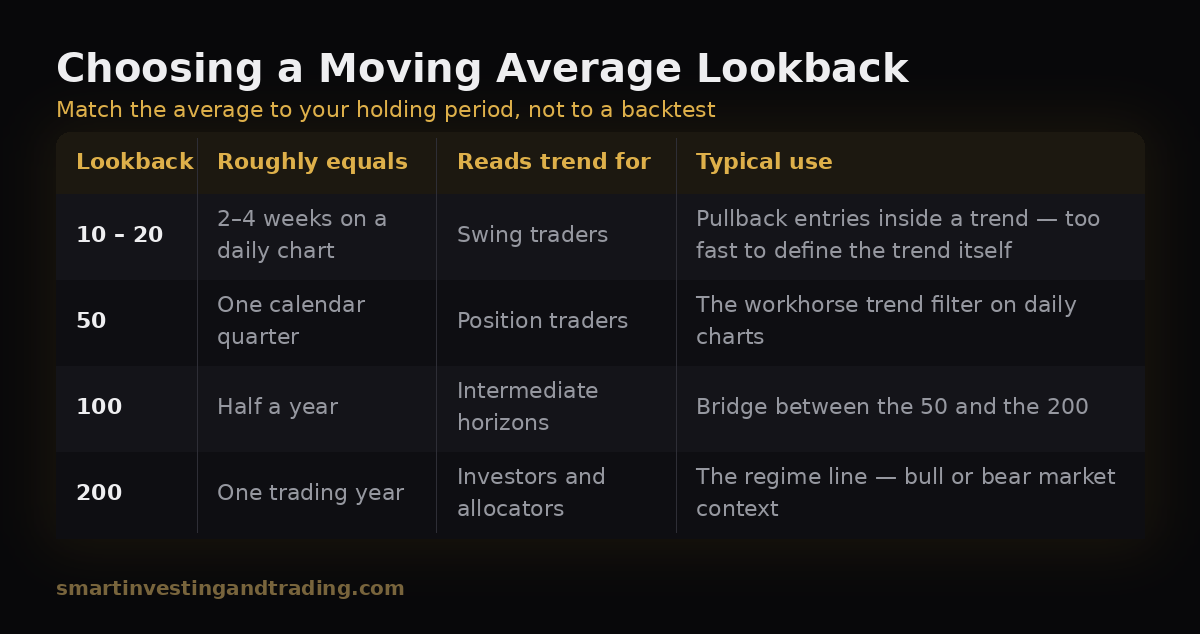
A practical rule that has served better than any specific number: your trend-defining average should cover roughly three to five times your intended holding period. If you hold trades for five days, a 20-period average defines your trend. If you hold for a quarter, the 200 does. When the average is too short relative to how long you hold, you get shaken out of trades that were fine. When it is too long, you sit through drawdowns your stop should have caught.
On the very long end, the 200-day has one genuine piece of academic support behind it. Brock, Lakonishok and LeBaron tested simple moving average rules on the Dow going back to 1897 and found the returns hard to explain away with the standard null models of the day (Journal of Finance, 1992). Later work challenged how much of that survives once you account for data snooping and transaction costs — which is the honest state of the evidence. The 200-day is a useful regime filter, not a printing press.
Putting it together: a trend scorecard
Rather than hunting for a single signal, score the four readings and let the total tell you how much conviction the chart deserves.
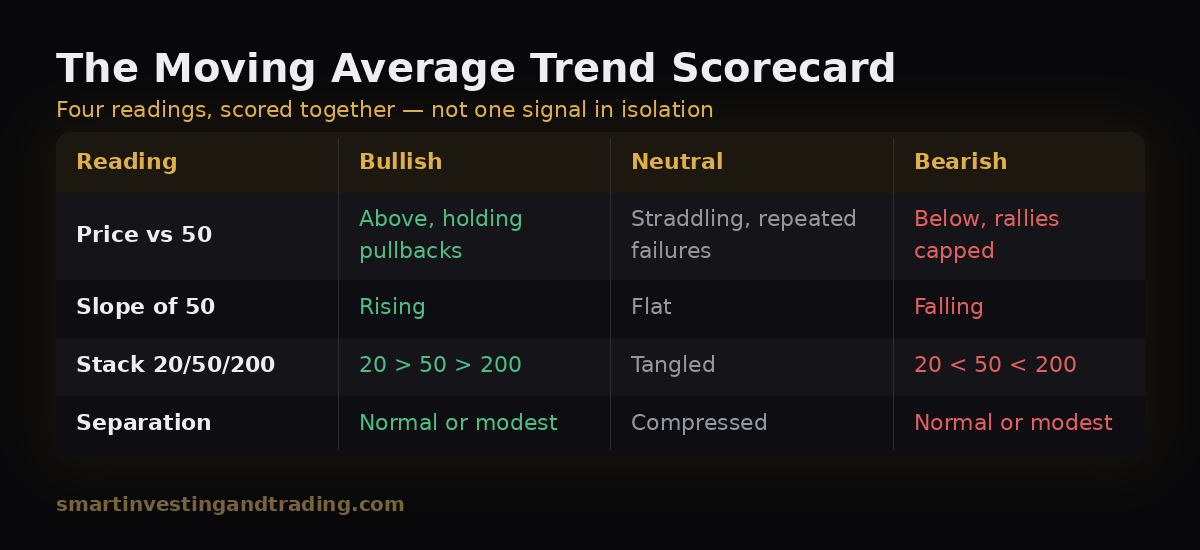
Four bullish readings is a trend you can trade with size and hold through noise. Two or three is a trend you trade smaller, with tighter management. Anything less and you are in a range — where the right tools are the oscillators, not trend-following rules. Stochastics and RSI are built for exactly the environment where moving averages are useless, which is why the two families belong on the chart together rather than in competition.
Timeframe alignment
Trend is not a property of a market. It is a property of a market on a timeframe. EUR/USD can be in a daily downtrend, a four-hour uptrend and a fifteen-minute downtrend at the same moment, and none of those readings is wrong.
The discipline that fixes most timeframe confusion is a two-step:
- Define trend one level up from the timeframe you trade. Trading the four-hour? The daily defines your trend.
- Time entries on your own timeframe, and only in the direction the level above allows.
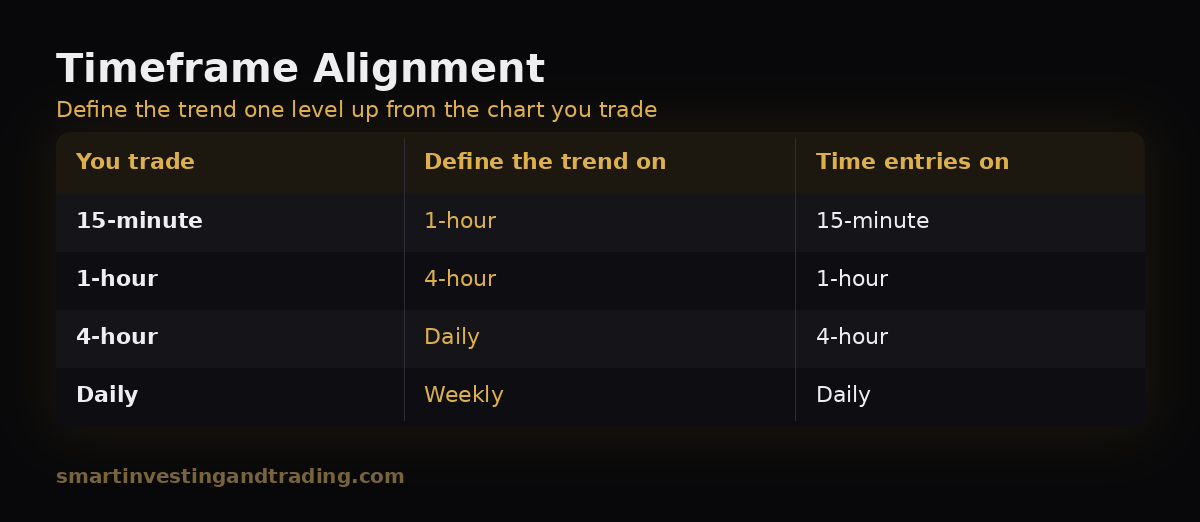
This is not a rule about moving averages specifically — it is a rule about analysis — but moving averages are the cleanest way to implement it, because “is the higher-timeframe 50 rising and is price above it?” is a question with a yes or no answer that takes two seconds to check.
Where traders go wrong
Treating a cross as the trend. A crossover is a change in the relationship between two averages. It is not the same thing as a trend, and in ranges it fires constantly. Crossovers deserve their own treatment — see moving average crossovers for entries — but they belong in the entry timing bucket, not the trend definition bucket.
Optimising the lookback. Backtest enough parameters on enough history and something will look excellent. It will look excellent because you searched for it, not because it is true. Pick a lookback from the logic of your holding period, not from a heat map of past returns.
Using a fast average to define trend. A 9-period average on a daily chart is not a trend filter. It changes direction every few days. Fast averages are for entry timing inside a trend that a slower average has already established.
Ignoring the instrument’s character. A 50-day average behaves very differently on a low-volatility rates market than it does on a single high-beta equity. Before settling on a lookback, look at how often price has historically crossed that average on that instrument. If it crosses forty times a year, it is not defining a trend for you.
Forgetting the average is a lagging summary. By the time the 200-day rolls over, a large part of the move is behind you. That is fine — the 200-day is not there to get you in at the low. Problems begin when traders expect a lagging tool to behave like a leading one, get disappointed, and speed it up until it produces nothing but noise.
Moving Averages Identify Trend – A checklist you can run in thirty seconds
Before any directional trade, on the chart you intend to trade:
- Is the trend-defining average rising, flat, or falling? (Compare to its own value a quarter of a lookback ago.)
- Is price above or below it, and how has it behaved on the last two touches?
- What is the stacking order of your short, medium and long averages?
- Is price at a normal distance from the average, or stretched?
- What does the timeframe one level up say?
If the answers do not line up, that is information. The best trades tend to be the ones where you do not have to argue with the chart to get a yes.
Moving Averages Identify Trend
Related reading on this site
- Pillar: Moving Averages: The Complete Guide
- SMA vs EMA vs WMA — which moving average should you use?
- The oscillator guide: Stochastics, RSI, CCI and Williams %R
- Bollinger Bands, MACD and Fibonacci: the indicator guide
External references
- StockCharts ChartSchool — Moving Averages: Simple and Exponential
- StockCharts ChartSchool — Moving Average Trading Strategies
- StockCharts ChartSchool — Distance From Moving Average
- Brock, Lakonishok & LeBaron (1992) — Simple Technical Trading Rules and the Stochastic Properties of Stock Returns, Journal of Finance
- Investopedia — Moving Average (MA)
- Investopedia — Golden Cross
FAQ – Moving Averages Identify Trend
Which moving average is best for identifying the trend? There is no single best one. Match the lookback to your holding period — roughly three to five times the number of bars you expect to hold. The 50-period is the standard daily-chart trend filter; the 200-period defines the longer regime.
Is price above the moving average enough to call an uptrend? No. Price above a flat average is a range. You want price above the average and the average rising. Slope is the reading that separates a trend from a sideways market.
Do exponential moving averages identify the trend better than simple ones? They respond faster, which helps at turns and hurts in ranges. For defining trend, the extra responsiveness is usually not an advantage — the slower simple average produces fewer false changes of direction.
Can moving averages work in a sideways market? Not for trend definition. When averages tangle and flatten, switch to oscillators and range tools rather than forcing trend-following rules on a market that has no trend.


Add comment