

Williams %R Explained: The Oscillator You Are Already Running Under Another Name
Williams %R
There is a chart layout you see constantly in trading forums and on social media. Price on top. Stochastic oscillator in the second panel. Williams %R in the third. The trader explains that when both line up, the signal is confirmed.
It is not confirmed. It is the same indicator, drawn twice, on two different scales.
Williams %R and the Fast Stochastic %K are the same calculation. Not similar. Not correlated. Identical, to the decimal place, separated only by an inversion and a shift of the axis. If you flipped one panel upside down and slid the scale, the two lines would sit on top of each other perfectly, every bar, forever.
That is the single most useful thing to know about this indicator, and almost no page that explains it says so plainly. What follows is what %R actually is, what Larry Williams actually prescribed, and the narrow set of jobs it does better than anything else in the oscillator drawer.
This is the fourth and final child article branching off the oscillators pillar, following the stochastic oscillator guide, the RSI guide and the CCI guide.
The formula, and the inversion
The calculation is the simplest in the oscillator family:
%R = (Highest High − Close) ÷ (Highest High − Lowest Low) × −100
Highest high and lowest low are taken over the lookback window. The number is multiplied by −100 to correct the inversion and move the decimal, which is why the indicator oscillates from 0 down to −100 rather than the 0-to-100 range you see on most oscillators.
Work through it once and the inversion stops being confusing. If the highest high is 110, the lowest low is 100 and the close is 108, the range is 10, the highest high less the close is 2, and 2 ÷ 10 = 0.20, which multiplied by −100 gives a %R of −20. Close at 103 instead and %R reads −70.
So a reading of 0 means today closed at the very top of the range. A reading of −100 means today closed at the very bottom. The scale runs from strength at the top to weakness at the bottom, exactly like every other oscillator — the negative signs are cosmetic.
Now compare it to Fast Stochastic %K:
%K = (Close − Lowest Low) ÷ (Highest High − Lowest Low) × 100
Same denominator. The numerator measures the distance from the opposite end of the range. <cite index=”6-1″>The result is that the Fast Stochastic Oscillator and Williams %R produce exactly the same lines, with only the scaling different.
The algebra is trivial: %R = %K − 100.
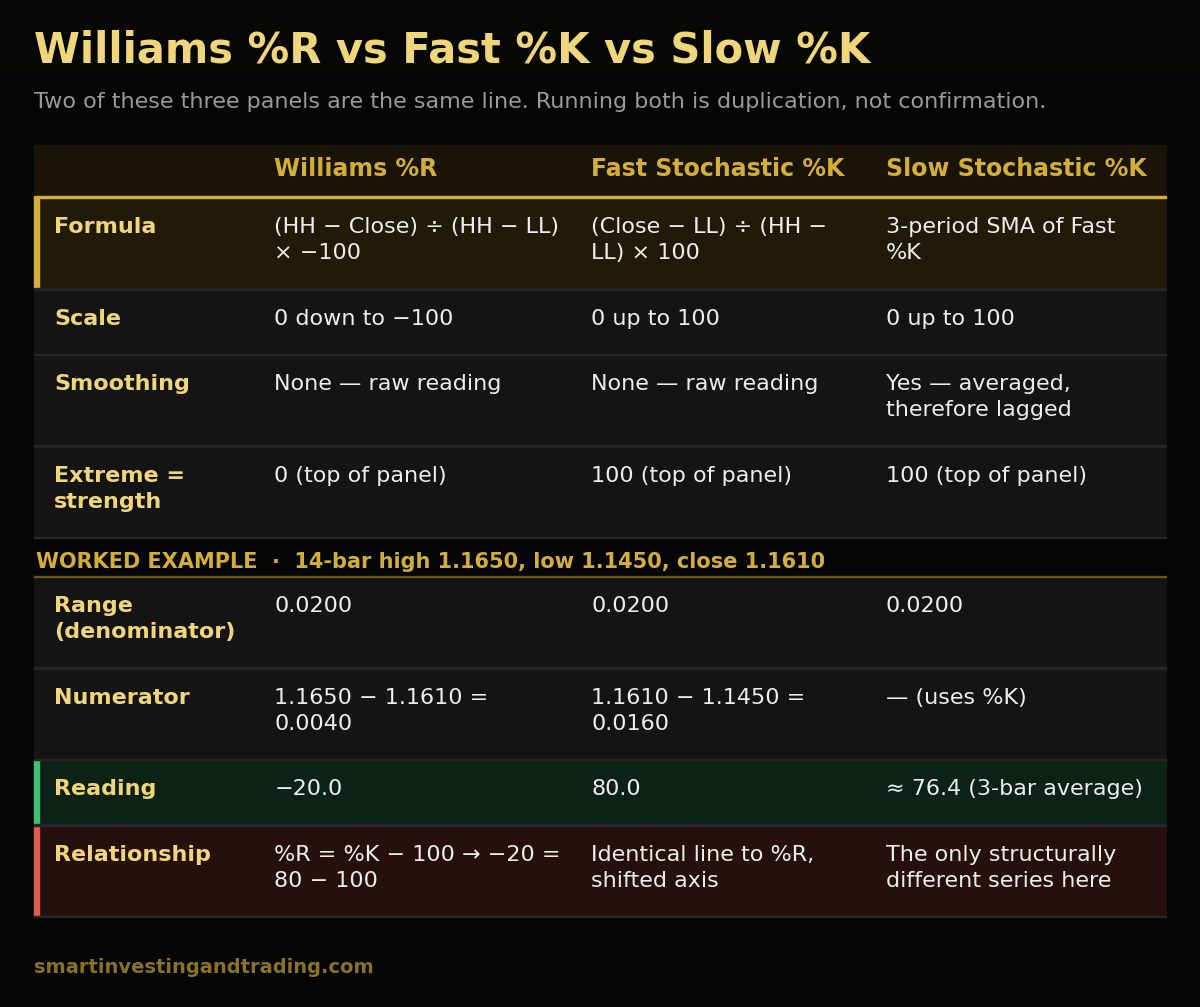
That relationship is not a curiosity. It has a hard practical consequence. Stacking %R under a Fast Stochastic gives you zero additional information — you have doubled the screen space and doubled the confidence for nothing. Worse, because the two panels move in lockstep by construction, every apparent “confirmation” is guaranteed in advance. You cannot get a disagreement. A signal that can never fail to confirm is not a filter, and treating it as one is how traders talk themselves into trades that a genuine second opinion would have vetoed.
If you want a second oscillator, it has to be built on different inputs. RSI, which measures the ratio of average gains to average losses rather than position in range, is a real second opinion. So is CCI, which measures deviation from a mean rather than position in a range. Williams %R is not.
Why the scale is upside down
The negative axis has a history behind it, and it explains why so much of the older literature reads backwards against your charts.
Williams introduced the tool in the early 1970s using a positive 0-to-100 scale, with 0 at the top representing an overbought close at the period high, and 100 at the bottom representing an oversold close at the period low. <cite index=”12-1″>The original formula in his book multiplied by 100 rather than −100; it is likely another publication printed it incorrectly and the mistake propagated, and most software has since implemented the negative version.</cite>
The practical fallout: when you read a 1970s or 1980s text describing a buy signal at “95%,” that maps to −95 on your platform, and it is at the bottom of your panel, not the top. When Williams writes about a sell above “10%,” that is −10 on your screen, sitting near the top. Two generations of secondhand articles have quietly mangled this, which is one reason the folk rules attached to %R are in worse shape than those attached to any other standard oscillator.
Get in the habit of reading the panel, not the sign. Near the top of the panel means closing near the top of the range. That is all it ever means.
What Williams actually prescribed
Three details of the original method get dropped in almost every modern write-up, and all three do real work.
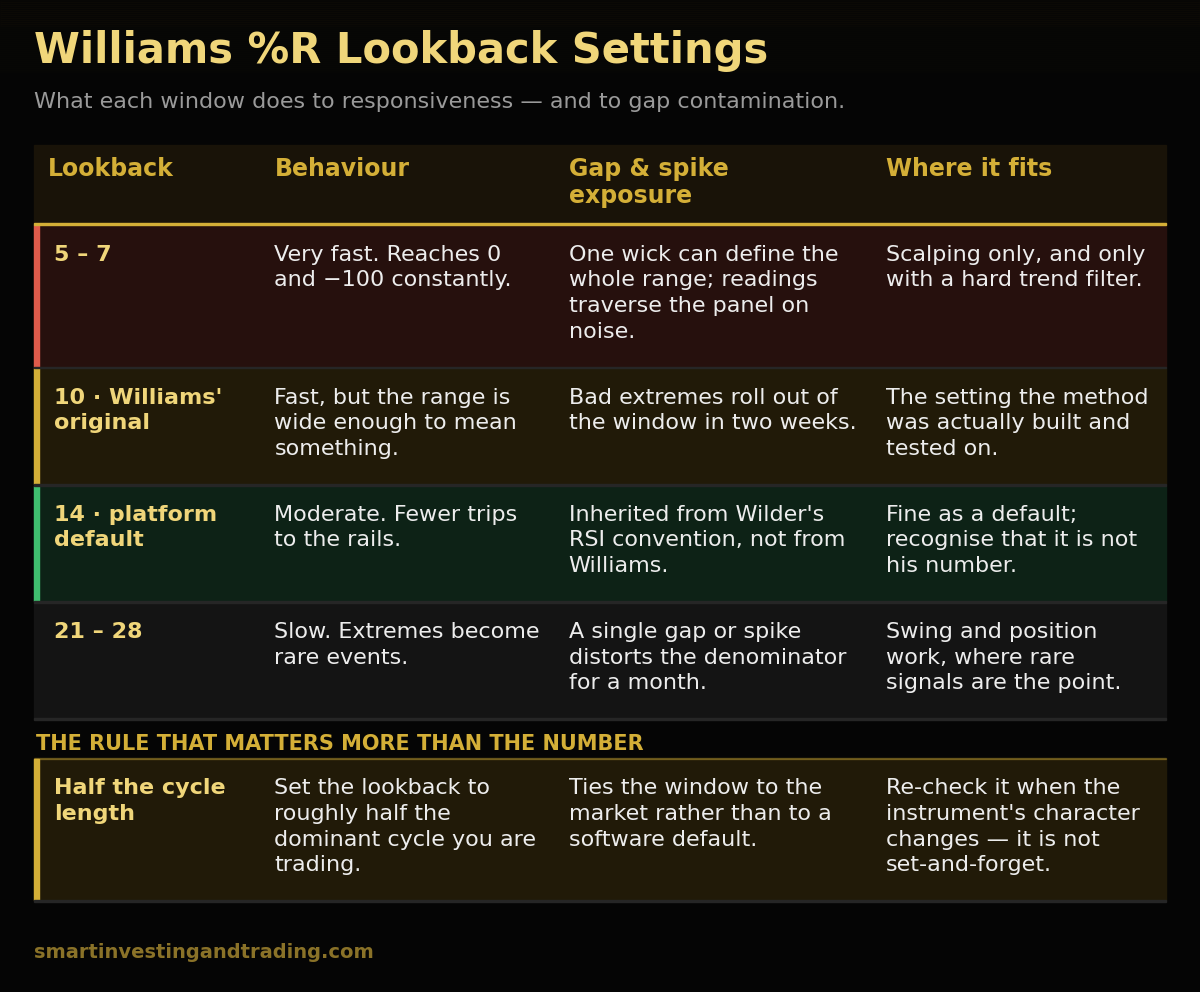
The lookback was 10, not 14. <cite index=”10-1″>Williams’ original method focused on 10 trading days to determine the market’s trading range, then calculated where the current day’s close fell within that range.</cite> The 14 you see as a platform default is inherited from Wilder’s RSI convention, not from Williams. It is not wrong, but it is not his.
Williams %R
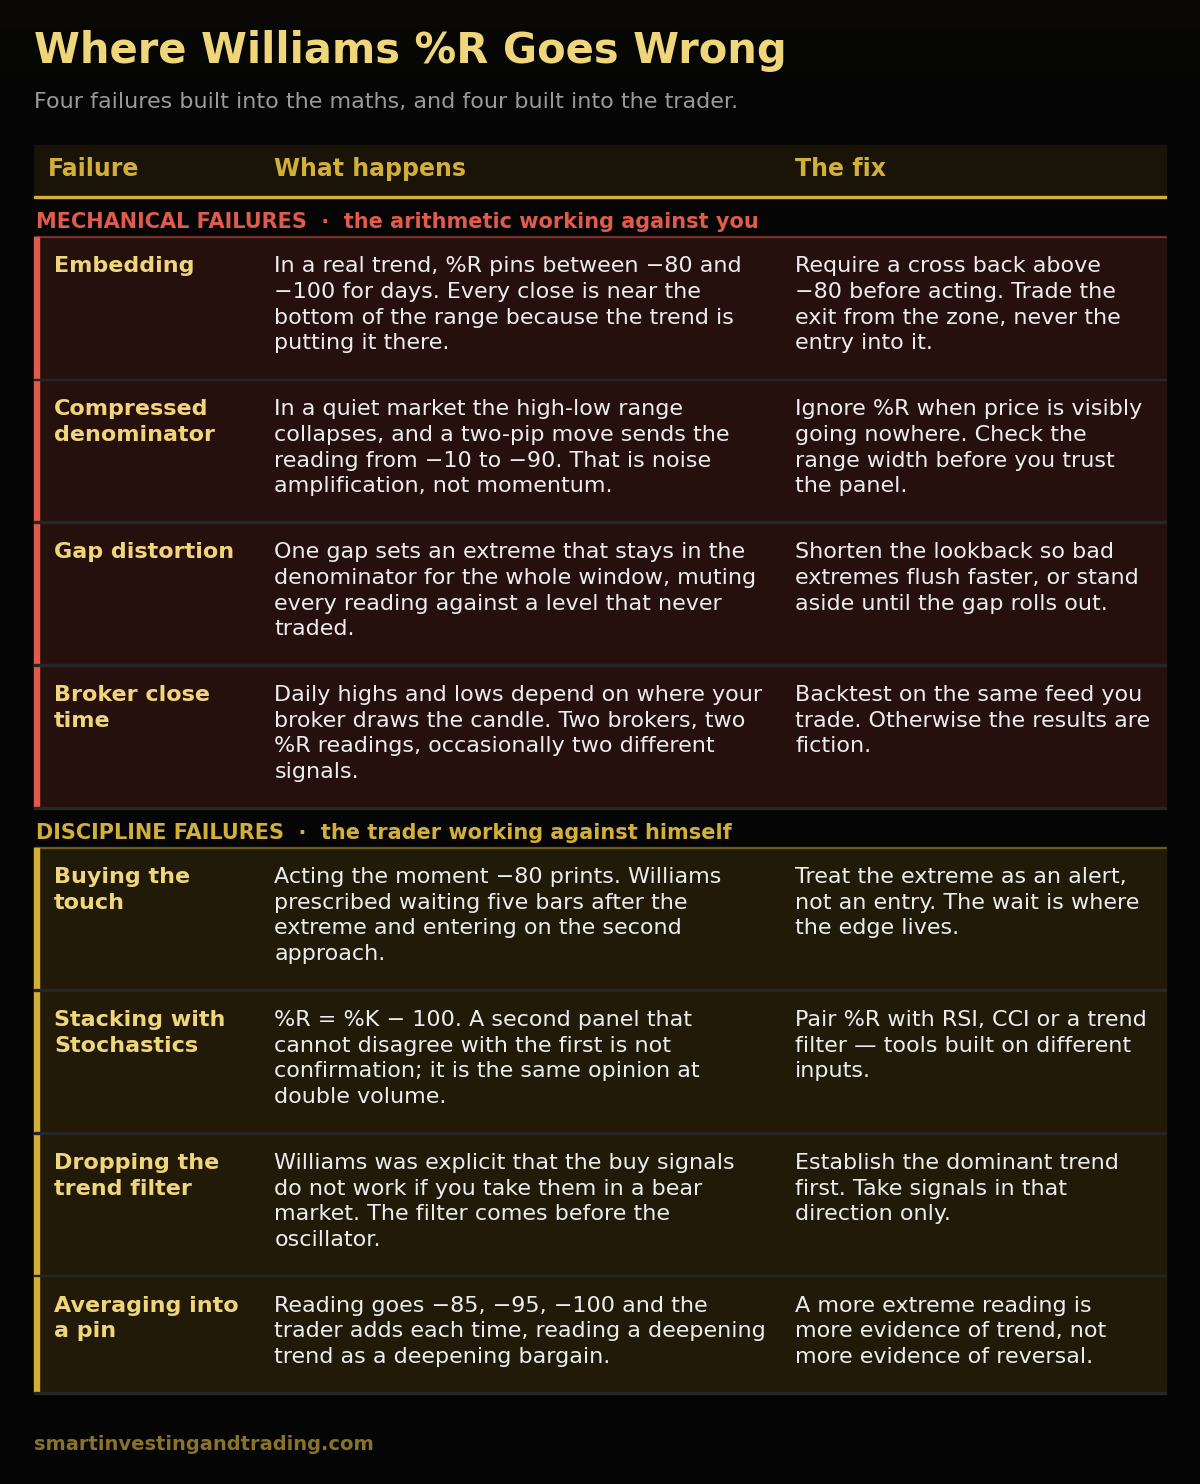
The signal was the hook off the extreme, not the touch. <cite index=”10-1″>Williams’ stated rules were to buy when %R reaches the oversold extreme, wait until five trading days have passed since that extreme was last reached, and then buy when %R returns to the 90–95 area.</cite> Read that carefully. The extreme is the alert. The entry comes later, after a cooling-off period, on the second approach. Nobody trades it that way now — and the difference between “buy the touch” and “buy the second approach after five bars” is most of the difference between a losing and a workable system.
The regime filter was not optional. This is the part that matters most, and it comes straight from Williams’ own text. He was explicit that his interest was on the buy side, that the buy signals were to be worked in bull markets, and that <cite index=”11-1″>the Percent R index will not work if you insist on acting on the buy signals during a bear market</cite>. He put the burden of identifying the dominant trend on the trader before the oscillator is consulted at all.
That is the same structural point the CCI guide makes about Lambert and the stochastic guide makes about Lane. Every one of these tools was designed with a trend filter bolted to the front of it, and in every case the retail version ships with the filter removed. It is not a coincidence. The filter is the hard part, the oscillator is the easy part, and software sells the easy part.
Embedding: why −80 is not a buy
In a genuine downtrend, %R will sit pinned between −80 and −100 for days or weeks. Every close lands near the bottom of the recent range, because every close is near the bottom of the recent range. That is the trend doing its job, not an oversold condition waiting to snap back.
<cite index=”7-1″>A market can hover around −20 through a strong uptrend and sit in −80 territory through a strong downtrend, which is why a reading below −80 is not an instruction to buy.</cite>
The technical name for this is embedding, and it is where naive %R systems bleed out. The failure sequence is always the same: reading hits −85, trader buys, reading goes to −95, trader averages down, reading goes to −100 and stays there, trader is now managing a losing position with an indicator that is telling him he is more right than he was before.
Two structural fixes:
Trade the exit from the zone, not the entry into it. Require %R to cross back above −80 before acting on an oversold reading. This costs a few points of the move and eliminates the majority of the embedded-trend disasters.
Use the midline as a regime read. <cite index=”6-1″>A cross above −50 means price is trading in the upper half of its high-low range for the lookback period; a cross below −50 means the bottom half.</cite> That is a cleaner and more honest use of the indicator than the extremes, and it is close to what the tool is genuinely measuring.
Williams %R
The denominator, gaps, and quiet markets
The range term in the denominator is where %R misbehaves in ways that are not obvious from a textbook chart.
Compressed ranges. In a very quiet market, the highest high and lowest low over the window converge. The denominator shrinks toward zero, and a two-pip move can send the reading the entire distance from −10 to −90. The oscillator is not detecting momentum at that point; it is amplifying noise. Whenever %R starts making full-scale traverses on a chart where price is visibly going nowhere, that is the arithmetic, not the market.
Gaps. A single gap sets a new extreme that stays in the denominator for the whole lookback window. For the next 10 or 14 bars, the indicator is measuring position within a range defined by a price level that was never actually traded through. Readings will look artificially mid-range for the entire period.
Single-bar spikes. Same mechanism. One news candle with a long wick redefines the range and mutes every subsequent reading until it rolls out of the window. This is the argument for keeping the lookback short if you want responsiveness — a 10-period window flushes bad extremes faster than a 21-period one.
The forex complication nobody mentions
%R depends entirely on the highest high and lowest low of the window, which means it depends entirely on where your broker draws the daily bar.
A broker closing the daily candle at 17:00 New York produces different daily highs and lows than one closing at 00:00 GMT. Different extremes, different denominator, different %R. Run the same 14-period %R on the same pair at two brokers and you will get readings that differ by 10 or 15 points at the same moment, and occasionally you will get one broker showing a hook back above −80 while the other has not triggered.
This affects every range-based indicator . Stochastics and CCI included. But it bites %R hardest because %R has no smoothing to absorb the discrepancy. If your entries are triggered mechanically off %R levels, you are also, quietly, trading your broker’s server time. Backtest on the same feed you trade, or the results are fiction.
There is a second forex-specific wrinkle. Twenty-four-hour markets have no overnight gap to reset the range, so ranges expand more smoothly than they do in equities. %R spends proportionally more time mid-panel. The extremes are rarer and, when they arrive, more meaningful. Traders who move from stocks to currencies often read this as the indicator being “less responsive” and shorten the lookback to compensate, which just re-imports the noise problem described above.
Williams %R
So when should you actually use it?
Given that it is Fast %K wearing a different jersey, the honest case for %R is narrow but real.
It is unsmoothed. Full and Slow Stochastic apply moving averages to %K. It is why they are usable as crossover systems and why they lag.
%R gives you the raw number. If what you want is the fastest possible read on where price closed within its recent range, %R delivers it with nothing standing in the way.
That is a legitimate reason to prefer it. But it means %R belongs in the slot where you would otherwise run Fast Stochastic, not alongside it.
It reads cleanly at the extremes. Because it is unsmoothed and bounded, the pin-to-the-rail behaviour at 0 and −100 is unambiguous. As a visual regime read — is this market closing at the top of its range every day, or the bottom. The panel does that at a glance better than a smoothed line does.
It pairs honestly with mean-based tools.
%R plus RSI, or %R plus CCI, or %R plus a moving-average trend filter. They are all genuine combinations because they measure different things. %R plus any Stochastic variant is not.
The bottom line is the same one running through this whole cluster. The indicator is a measurement, not a decision. Williams told you to establish the dominant trend first and only then let %R time the entry. Sixty years of platform defaults have inverted that order. It handed traders the timing tool with the trend filter stripped out. Printed two dotted lines at −20 and −80 to suggest the tool makes the decision for you. It does not, and it never did.


Add comment