

CCI Explained: Lambert’s Cycle Tool, Why ±100 Is a Breakout Level, and the Denominator That Lies to You
Cci indicator guide
The Commodity Channel Index is the most widely misused indicator in the standard platform library. Not because it is complicated — the maths is simpler than RSI — but because the way almost everyone trades it is the exact inverse of what its author designed it to do.
Open any charting package and the CCI comes with dotted lines at +100 and −100, labelled overbought and oversold. Sell the top line, buy the bottom line. That is the folk wisdom.
Donald Lambert built those lines as entry triggers in the direction of the move. Cross above +100, go long. Not sell. Long.
Somewhere between 1980 and the arrival of retail charting software, the indicator got flipped on its head, and a whole generation of traders learned to fade the signal its creator designed to follow. Both approaches can be made to work — but only in opposite market conditions, and if you do not know which one you are running, you are not trading a system, you are trading a coin toss.
This is the third child article branching off the oscillators pillar, following the stochastic oscillator guide and the RSI guide.
Cci indicator guide
What Lambert actually built
Donald R. Lambert introduced the CCI in the October 1980 issue of Commodities magazine, in an article titled “Commodity Channel Index: Tool for Trading Cyclic Trends.” The title matters. This was not a general-purpose momentum oscillator. It was a timing tool for cyclical and seasonal markets — grains, softs, energy — where the trader already believed a cycle existed and needed help identifying when each leg of it began and ended.
Lambert was explicit that the CCI does not find cycles. You bring the cycle; the indicator times it.
The calculation:
Typical Price (TP) = (High + Low + Close) / 3

CCI = (TP − SMA of TP) / (0.015 × Mean Deviation)
Where Mean Deviation is the average of the absolute differences between each period’s typical price and the current SMA of typical price.
Three things in that formula are routinely got wrong.
One: it is mean deviation, not standard deviation. You take the absolute value of each deviation and average them. You do not square anything. This makes the CCI less sensitive to single outlier bars than a z-score or a Bollinger Band calculation would be — an outlier moves a mean deviation linearly but moves a standard deviation quadratically. That is a real behavioural difference, not a trivia point.
Two: the 0.015 constant is a scaling choice, not a law of nature. Lambert picked it so that roughly 70–80% of readings would land inside the ±100 band on the data he was working with. The reciprocal, 1/0.015 ≈ 66.7, is just the multiplier that stretches a mean-deviation unit onto a convenient scale. Change the lookback and that 70–80% figure changes with it: a 10-period CCI spends far more time outside the band, a 40-period CCI far less.
Three: the typical price uses the high and the low. Unlike RSI, which is a pure close-to-close calculation, the CCI sees the bar’s range. On instruments with meaningful intrabar excursion — futures, FX during news, anything with gaps — this makes the CCI respond to information the RSI is structurally blind to.
What you end up with is essentially a standard score in mean-deviation units: how far is price from its own recent average, measured in units of its own recent average dispersion. Lambert himself described it as akin to a statistical standard score.
That framing tells you what the CCI is genuinely good at, and it is not what the platform defaults suggest.
Cci indicator guide – Unbounded, and why that changes everything
The stochastic cannot print above 100. The RSI cannot print above 100. Both are ratios with hard ceilings baked into the arithmetic.
The CCI has no ceiling. It can print +340. It can print −480. There is no arithmetic constraint stopping it, because the numerator can grow without limit while the denominator only reflects recent typical dispersion.
This is not a defect. It is the CCI’s single most useful property, and it is the reason it belongs on a chart alongside a bounded oscillator rather than instead of one.
A bounded oscillator pinned at 98 tells you almost nothing. It has run out of room, and it will read 98 whether the move is strong or absurd. The CCI never runs out of room. A reading of +310 and a reading of +120 are genuinely different statements about the same market, and the indicator preserves that difference instead of compressing it away.
The trade-off: you lose the comfort of fixed thresholds. There is no universal overbought level for an unbounded series. What counts as extreme for a stock index ETF is unremarkable for a single-name growth stock or a crypto pair. You have to calibrate to the instrument. Most traders do not, which is why they get chopped up applying equity thresholds to FX or FX thresholds to commodities.
Cci indicator guide
The two schools, and how to tell which one you are in
Here is the split that resolves most CCI confusion.
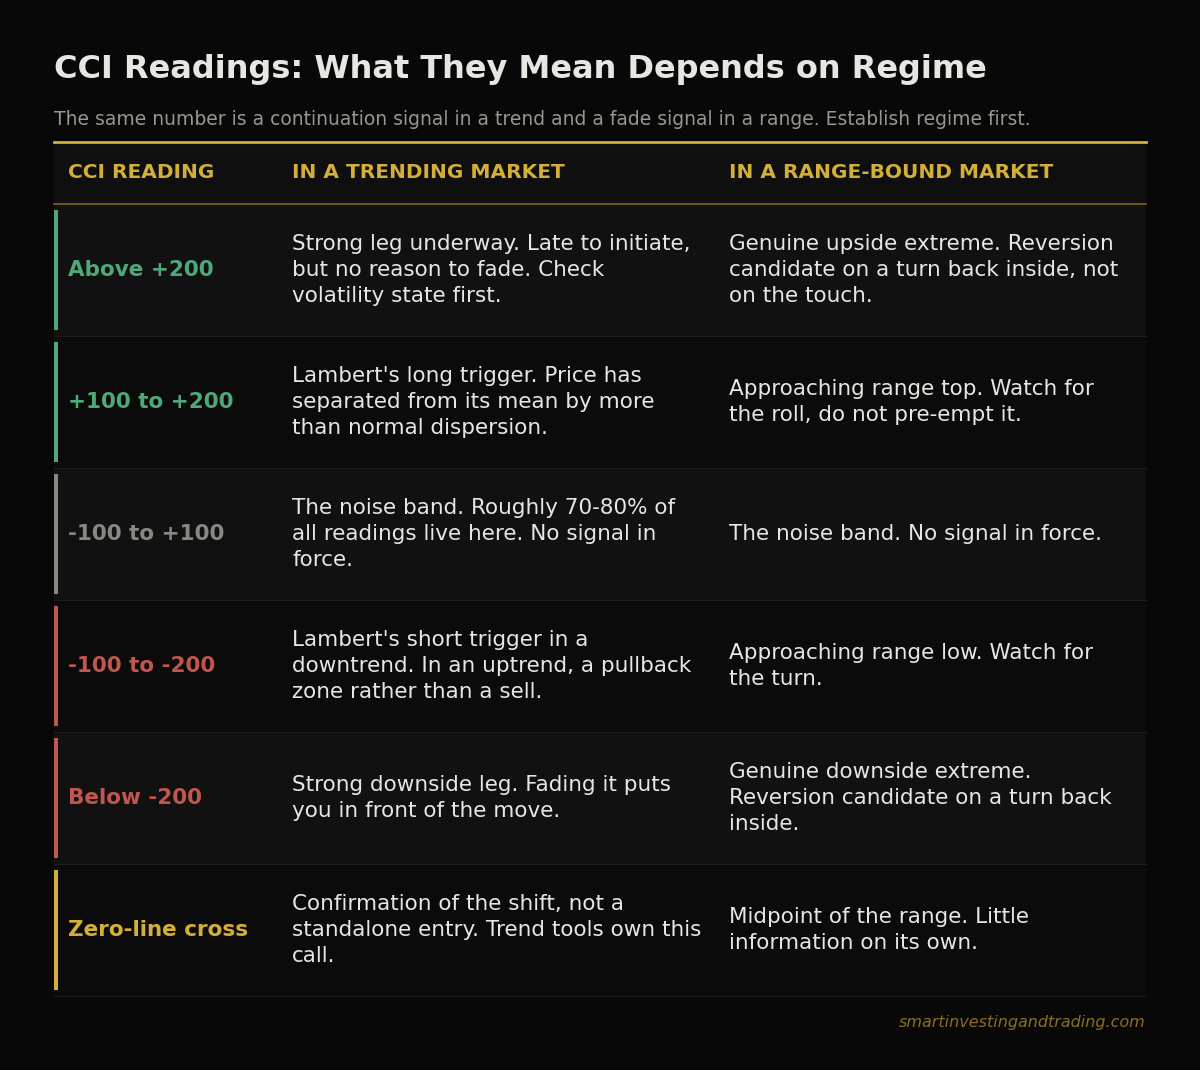
Lambert’s school — breakout. ±100 is the boundary of the noise band. Inside it, nothing is happening; roughly three-quarters of all readings live there and produce no signal. A cross above +100 says price has separated from its average by more than its normal dispersion, which is evidence a new leg has begun. Enter long. Exit when it drops back below +100. Symmetrically for the downside. In this reading, the signal is only in force 20–30% of the time, by design.
The modern school — reversion. ±100 is overbought/oversold, and the extremes are faded. Because ±100 is far too common to be a genuine extreme on most instruments, practitioners who trade this way generally use ±200 or wider, and require a turn back inside the level rather than the touch itself.
These are not variations on a theme. They are opposite trades on the same event.
The reconciliation is regime, exactly as it was for the stochastic:
- Trending market → Lambert’s reading is correct. Cross above +100 is a continuation signal. Fading it puts you in front of the move.
- Range-bound market → the reversion reading is correct. Extremes revert, because ranges are defined by the fact that extremes revert.
Which means the CCI, like every other oscillator in this cluster, cannot be traded until you have answered the regime question with a tool that is not an oscillator. ADX, Bollinger Band width, a moving-average slope, market structure — anything that measures trend presence rather than momentum. The pillar post covers the regime test in detail.
Take away the regime filter and CCI signals have no fixed meaning. Not a weak meaning. No meaning.
Cci indicator guide – The denominator problem
Here is the mechanical failure mode nobody warns you about, and it is specific to CCI in a way it is not to RSI or stochastics.
The denominator is the market’s own recent mean deviation. In a quiet, compressed market, that number collapses. When the denominator collapses, a tiny numerator produces a huge reading.
So a market doing nothing — three points of range, no participation, holiday tape — will happily print CCI values of +250. Not because anything is happening, but because the yardstick shrank. The indicator is measuring the move in units of a ruler that just got very small.
This is the CCI equivalent of the stochastic’s flatline problem, and it produces the same result: a stream of confident-looking extreme readings generated entirely by the absence of activity.
The protection is to check the denominator’s own state before believing the reading. Practically: look at Bollinger Band width or ATR alongside the CCI. If band width is at the low end of its recent range and the CCI is printing ±200, the CCI is amplifying noise. Ignore it. If band width is normal or expanding and the CCI prints ±200, the reading is real.
This pairing is why the CCI slots naturally against the Bollinger Bands from the first pillar cluster. They are close cousins — both measure distance from a moving average in units of dispersion — but Bollinger uses standard deviation and displays the result in price space, while the CCI uses mean deviation and displays it in a separate pane. Reading them together gives you the numerator and the denominator separately, and that is the whole diagnosis.
Cci indicator guide – Lookback: the cycle rule everyone dropped
Lambert’s own guidance on period selection has almost entirely disappeared from modern coverage, which is odd given it is the most defensible parameter rule in technical analysis.
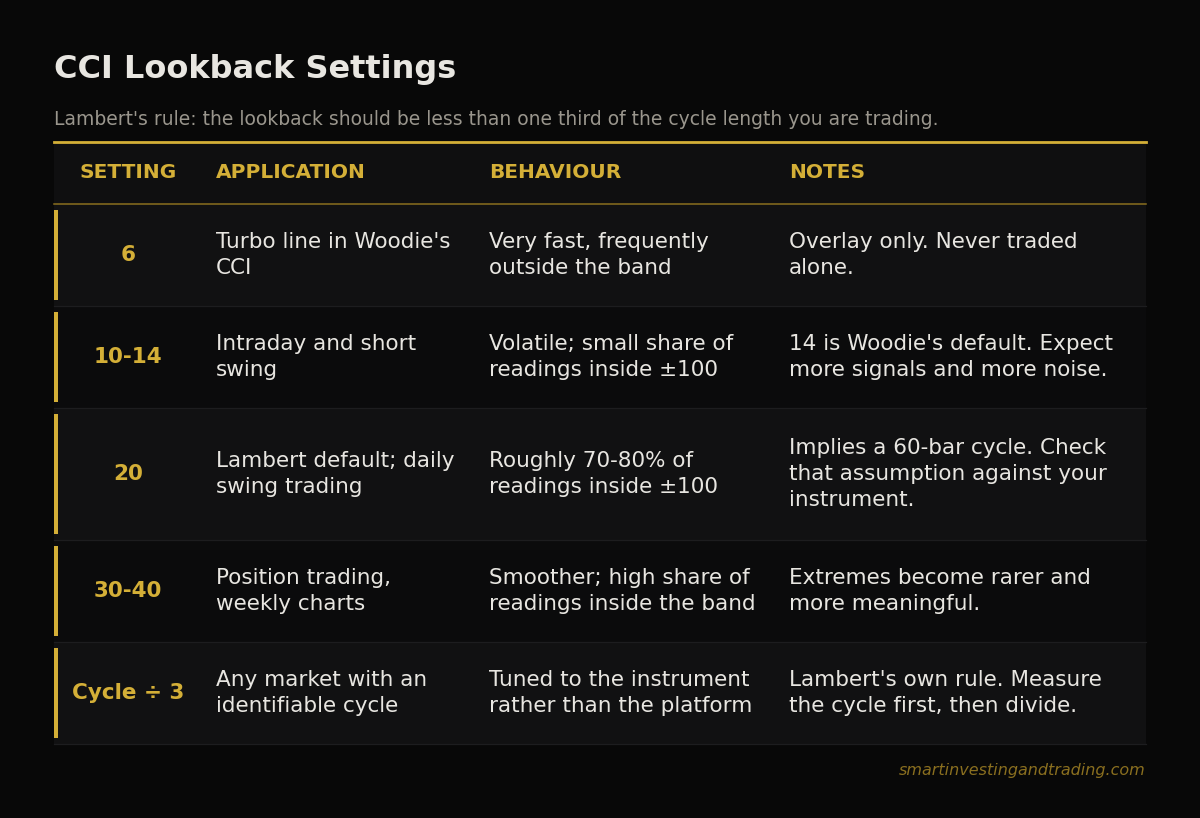
His finding: the lookback should be less than one third of the cycle length for the indicator to work efficiently.
So if you have identified a 60-bar cycle in your instrument, use 20 bars or fewer. A 90-bar cycle, 30 bars or fewer. The default 20-period setting is not a universal constant — it is the answer to a 60-bar cycle, which happens to be roughly a quarter of a year on daily bars in the seasonal commodity markets Lambert was trading.
This is worth taking seriously, because it converts a parameter you would otherwise pick by superstition into one derived from something observable in your own market. Whether you measure the cycle with a formal detrended oscillator, a spectral tool, or just by eyeballing the average bar count between significant swing lows, you will get a defensible number, and it will beat “20 because that’s what came with the platform.”
The general behavioural rule follows from the arithmetic: shorter lookbacks make the CCI more volatile with more time spent outside ±100; longer lookbacks smooth it and keep it inside the band more often.
Woodie’s CCI, briefly
Any search on this indicator will turn up Woodie’s CCI, a fully developed pattern-based system built on a 14-period CCI with a 6-period “turbo” line overlaid. It has its own vocabulary — zero-line reject, trend line break, ghost, camelback — and a large following.
It is worth knowing about for two reasons. First, it demonstrates that CCI patterns can be traded structurally rather than as threshold crossings, which is generally the more robust approach. Second, its central premise is that CCI signals must be taken in the direction of the established trend, which is Lambert’s original framing, not the fade-the-extremes folk version. On that point it is on the right side of the argument.
The caution is the usual one for any named pattern system: the patterns are discretionary, the rules are elaborate, and the edge is in the trend filter far more than in the pattern taxonomy.
Where CCI earns its keep
Given all of the above, the honest case for putting the CCI on your chart:
It measures a different thing than RSI or stochastics. The stochastic measures position within a range. RSI measures the up/down velocity ratio. CCI measures distance from a mean in dispersion units. Those three can genuinely disagree, and when they do, the disagreement carries information. This is the opposite of the Williams %R situation, where the “second” indicator is an algebraic restatement of the first and can never disagree with it.
It is scale-free and cross-market comparable. Because it normalises by the instrument’s own dispersion, a CCI of +180 on gold and a CCI of +180 on the Bund describe structurally similar conditions relative to each instrument’s own behaviour. Raw price momentum does not give you that.
It handles gaps and range expansion. The typical price input means the CCI registers intrabar violence that close-only indicators miss entirely.
It has a defensible parameter rule. The cycle relationship gives you a principled way to set the lookback, which is more than most indicators offer.
Where it does not earn its keep: as a standalone reversal signal, in compressed markets, or on any instrument where you have not calibrated the threshold to that instrument’s own CCI distribution.
Cci indicator guide – Putting it on a chart properly
A workable arrangement:
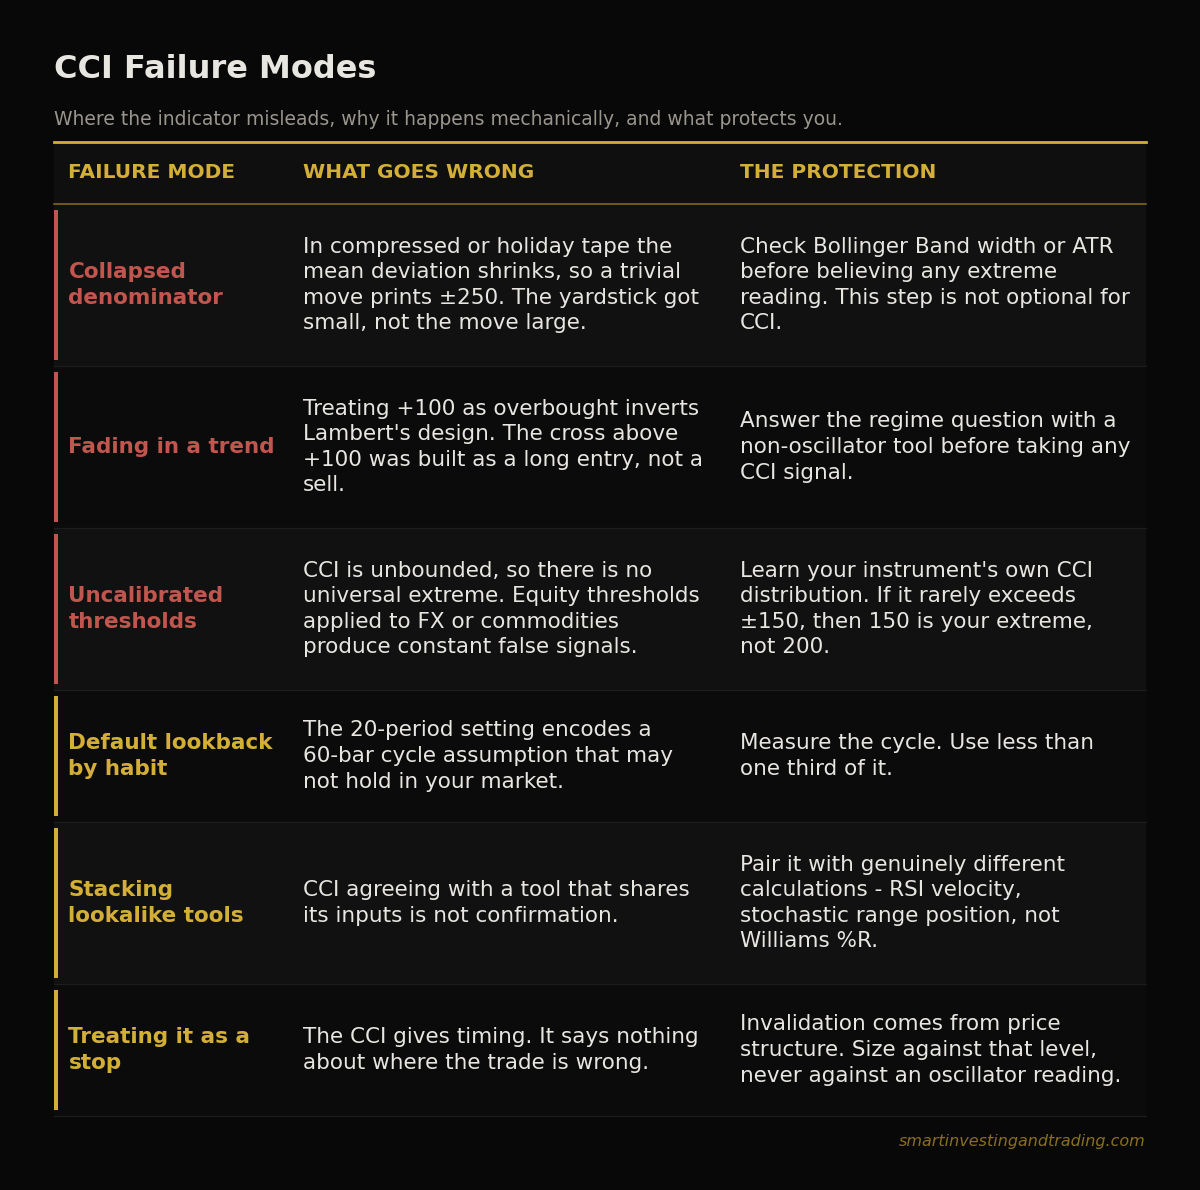
- Regime — establish trend or range with a non-oscillator tool before you look at the CCI at all.
- Volatility state — check Bollinger Band width or ATR to confirm the denominator is not collapsed. This step is not optional for CCI specifically.
- Direction — in a trend, take CCI signals in the trend direction only, Lambert-style.
- Calibration — know your instrument’s own CCI distribution. If it rarely exceeds ±150, then ±200 is not your extreme level; ±150 is.
- Structure and invalidation — the CCI gives timing. It does not give you a stop. Price structure does that.
The indicator appears at step three of five, and its reading is conditional on steps one and two. That is the correct level of authority to grant it.


Add comment