

RSI Explained: Wilder’s Levels, Cardwell’s Ranges, and Why 70 Is Not a Sell Signal
RSI indicator explained
Ask ten traders what RSI does and nine will tell you it shows overbought and oversold. Ask them what “overbought” means and the answers fall apart. Too high? Too fast? Due to fall? Those are three different claims, and the RSI only supports one of them — the middle one.
The Relative Strength Index measures the velocity of price change, not its extremity and not its sustainability. A reading of 78 says the last fourteen bars produced far more upside movement than downside movement. It says nothing whatsoever about whether the fifteenth bar will be red. Markets can, and routinely do, keep printing 70-plus readings for months.
This is the second child article branching off the oscillators pillar, following the stochastic oscillator guide. Here we take RSI apart properly: what Wilder actually built, why the levels he chose were 70 and 30 rather than the 80 and 20 you see recycled across the internet, the range rules that make the indicator behave completely differently in trends, and the specific structural failures that generate the signals that cost people money.
RSI indicator explained
What RSI actually measures
J. Welles Wilder Jr. introduced the Relative Strength Index in New Concepts in Technical Trading Systems (1978), alongside ATR, ADX and the Parabolic SAR. The name has caused four decades of confusion — RSI has nothing to do with relative strength in the equity-analysis sense of comparing one instrument against another or against an index. It is entirely internal to a single instrument.
The question RSI answers is:
Over the last N periods, how much of the total price movement was upward?
That is it. Not how far price has travelled. Not whether the move is stretched. Just the ratio of up-movement to total movement, expressed on a 0–100 scale.
The formula:
RS  = Average Gain over N periods / Average Loss over N periods
RSI = 100 − (100 / (1 + RS))
Two details in that calculation matter more than most people realise.
First, the averaging is Wilder’s smoothing, not a simple average. The first value uses a simple mean of gains and losses over the initial N bars. Every value after that is smoothed:
Average Gain = ((Previous Average Gain × (N − 1)) + Current Gain) / NThis is mathematically an exponential moving average with a smoothing factor of 1/N — noticeably slower than a standard EMA of the same period, which uses 2/(N+1). It is why RSI is smoother than most people expect, and why it rarely reaches the true extremes of 0 and 100.
Second, gains and losses are treated separately and always as positive numbers. A down bar contributes zero to average gain and its absolute size to average loss. That asymmetry is the engine of the whole indicator.
The consequence: RSI hits 100 only if there has been no down close at all in the lookback window, and 0 only if there has been no up close. Both are vanishingly rare on a 14-period setting. Readings above 90 or below 10 on daily charts of liquid instruments are genuinely unusual events, not routine ones.
RSI is not a stochastic
This distinction is the single most useful thing in this article, so it gets its own section.
The stochastic oscillator measures where the close sits inside the recent high-low range. It is a position measurement. Price can grind sideways at the top of a range and the stochastic will sit at 95 indefinitely.
RSI measures how one-sided the recent closes have been. It is a velocity measurement. Price can sit at the top of its range while RSI falls, because what RSI cares about is the mix of up closes and down closes, not the level.
That is why the two indicators disagree so often, and why the disagreement is informative rather than annoying. Stochastic pinned at 90 with RSI at 55 tells you price is holding the highs but the buying has stopped being one-sided — distribution, not acceleration. Same chart, two different questions, two different answers.
If you run both, run them for that reason. If you run both and treat them as confirmation of each other, you have two copies of one opinion and a false sense of agreement.
RSI indicator explained
Wilder’s levels: 70 and 30
Wilder set the thresholds at 70 and 30 with a 14-period lookback. Those numbers are not arbitrary and they are not interchangeable with the stochastic’s 80/20.
Because of the smoothing described above, RSI’s distribution is tighter than the stochastic’s. A stochastic spends a great deal of time above 80 and below 20; RSI spends comparatively little time above 70 and below 30. Applying 80/20 to RSI does not make it “more selective” — it makes it fire so rarely that in many instruments it only triggers at genuine capitulation, which is a different tool for a different job. You may want that. Just know that is what you have built.
The widespread “RSI overbought is 80” claim you will find in scraped indicator guides is a stochastic level pasted onto the wrong indicator. It comes from copying, not from Wilder.
More importantly, Wilder did not present 70 and 30 as entry triggers. In his framework they mark zones where the momentum is one-sided enough to warrant attention — a state, not an instruction.
RSI indicator explained
Wilder’s failure swings — the signal he actually preferred
Wilder considered failure swings a stronger reversal indication than divergence, and almost nobody uses them. They are entirely a function of the RSI line itself and ignore price.
Top failure swing (bearish):
- RSI rises above 70.
- RSI pulls back, forming a trough — call this the failure point.
- RSI rallies again but fails to exceed its prior peak.
- RSI breaks below the failure point.
Step four is the signal. Steps one to three are setup.
Bottom failure swing (bullish): the mirror image below 30 — RSI drops under 30, bounces to a peak, makes a lower low that stays above 30, then breaks above that intervening peak.
The reason this works better than raw divergence is that it requires a structural break in the oscillator, not merely a shape you can see with your eye. Divergence tells you momentum is fading. A failure swing tells you the momentum structure has actually broken. The first is a warning; the second is closer to an event.
RSI indicator explained
Cardwell’s range rules — the part that changes everything
Andrew Cardwell, who taught RSI professionally for decades, made an observation that reframes the indicator entirely: RSI travels in different ranges depending on trend direction.
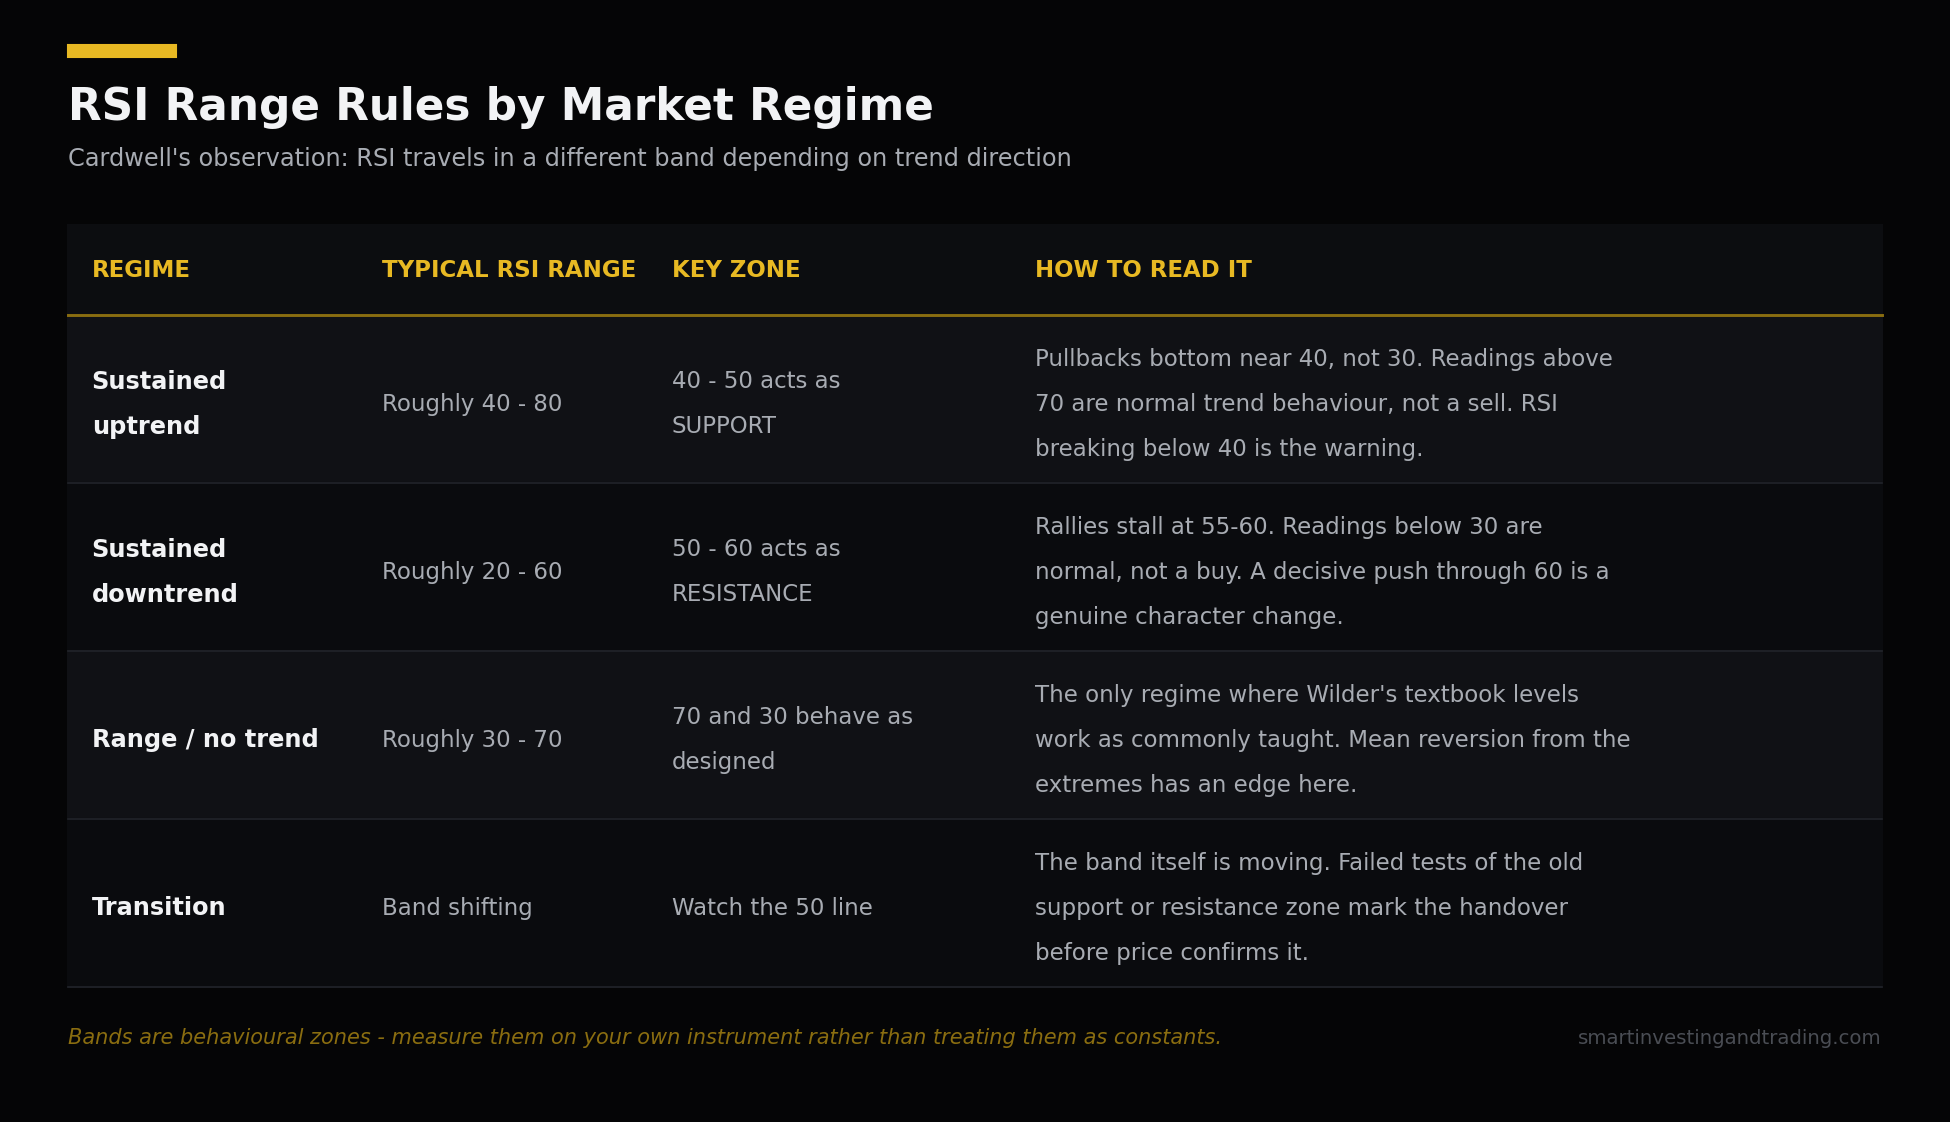
In a sustained uptrend, RSI tends to oscillate roughly between 40 and 80, with the 40–50 zone acting as support. Pullbacks in a healthy bull trend bottom out around 40, not at 30. The RSI reaching 30 in an uptrend is not a better buy — it is evidence the uptrend is in trouble.
In a sustained downtrend, RSI tends to oscillate roughly between 20 and 60, with the 50–60 zone acting as resistance. Rallies stall there. An RSI that pushes decisively through 60 in a downtrend is a genuine character change.
(Different sources cite these bands slightly differently — 40–80 and 20–60 are the common formulation, some use 40–90 and 10–60. Treat them as behavioural zones to be measured on your own instrument, not as constants.)
The practical implication is severe: a fixed 70/30 rule applied across all regimes will systematically fight the trend. In a bull market you will be handed sell signals at every push into 70 and buy signals almost never. In a bear market, the reverse. This single fact explains most of the money lost with RSI.
Determine the regime first. Then read the oscillator against the regime’s range, not against a textbook number.
Divergence, and Cardwell’s reversals
Regular divergence — price makes a higher high while RSI makes a lower high (bearish), or price makes a lower low while RSI makes a higher low (bullish) — is a fading-momentum warning. It is not a trigger. In a strong trend, regular divergence appears repeatedly and resolves in the direction of the trend far more often than it reverses it. Divergence tells you the move is being driven by fewer, smaller pushes. That is a reason to tighten a stop or scale out. It is not a reason to reverse position.
Hidden divergence — price makes a higher low while RSI makes a lower low (bullish), or price makes a lower high while RSI makes a higher high (bearish) — points with the trend and is a continuation signal. It is the more useful of the two and it is discussed far less.
Cardwell added a third construct he called positive and negative reversals, which are the inverse of divergence:
- Positive reversal: price makes a higher low while RSI makes a lower low → bullish continuation. Price held better than momentum did.
- Negative reversal: price makes a lower high while RSI makes a higher high → bearish continuation. Momentum improved and price could not follow.
Note that Cardwell’s positive reversal and hidden bullish divergence describe the same geometry. The value of the reversal framing is that it makes the interpretation explicit: this is a continuation pattern, and it should be read as strength, not as a discrepancy to be resolved against price.
Settings
Wilder’s 14 remains the default and there is no strong evidence that a different number is universally better. What changes with the setting is not accuracy but character.
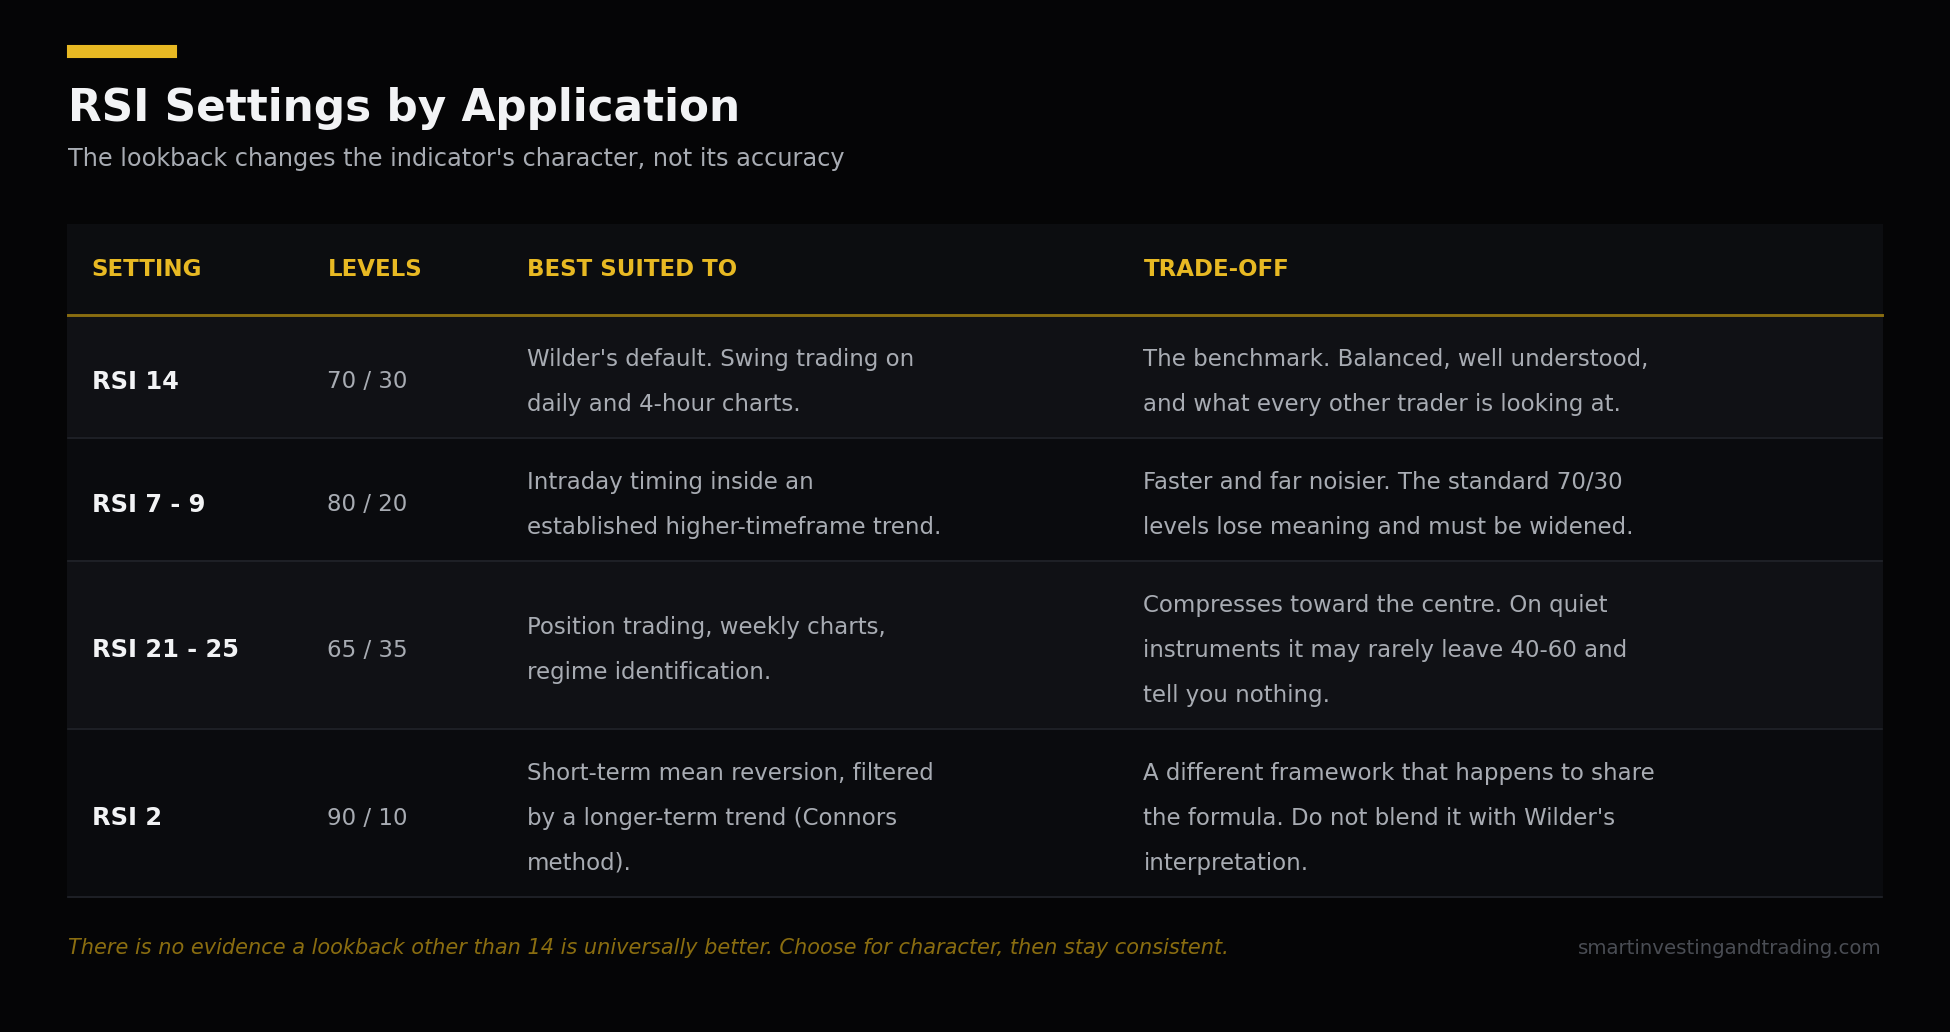
Shorter lookbacks (7–9) produce a faster, wider-swinging line that reaches 70 and 30 frequently. More signals, more noise, and the 70/30 levels lose meaning quickly — you would want to widen them.
Longer lookbacks (21–25) compress the range. The line may rarely leave 40–60 on a quiet instrument, at which point the thresholds need narrowing or the indicator tells you nothing.
A genuine special case worth knowing: the 2-period RSI popularised by Larry Connors for short-term mean reversion, used with extreme levels around 90/10 and only in the direction of a longer-term trend filter. It is a legitimate and well-documented approach, but it is a different tool from Wilder’s RSI in everything except the formula. Do not blend the two frameworks.
Where RSI lies to you
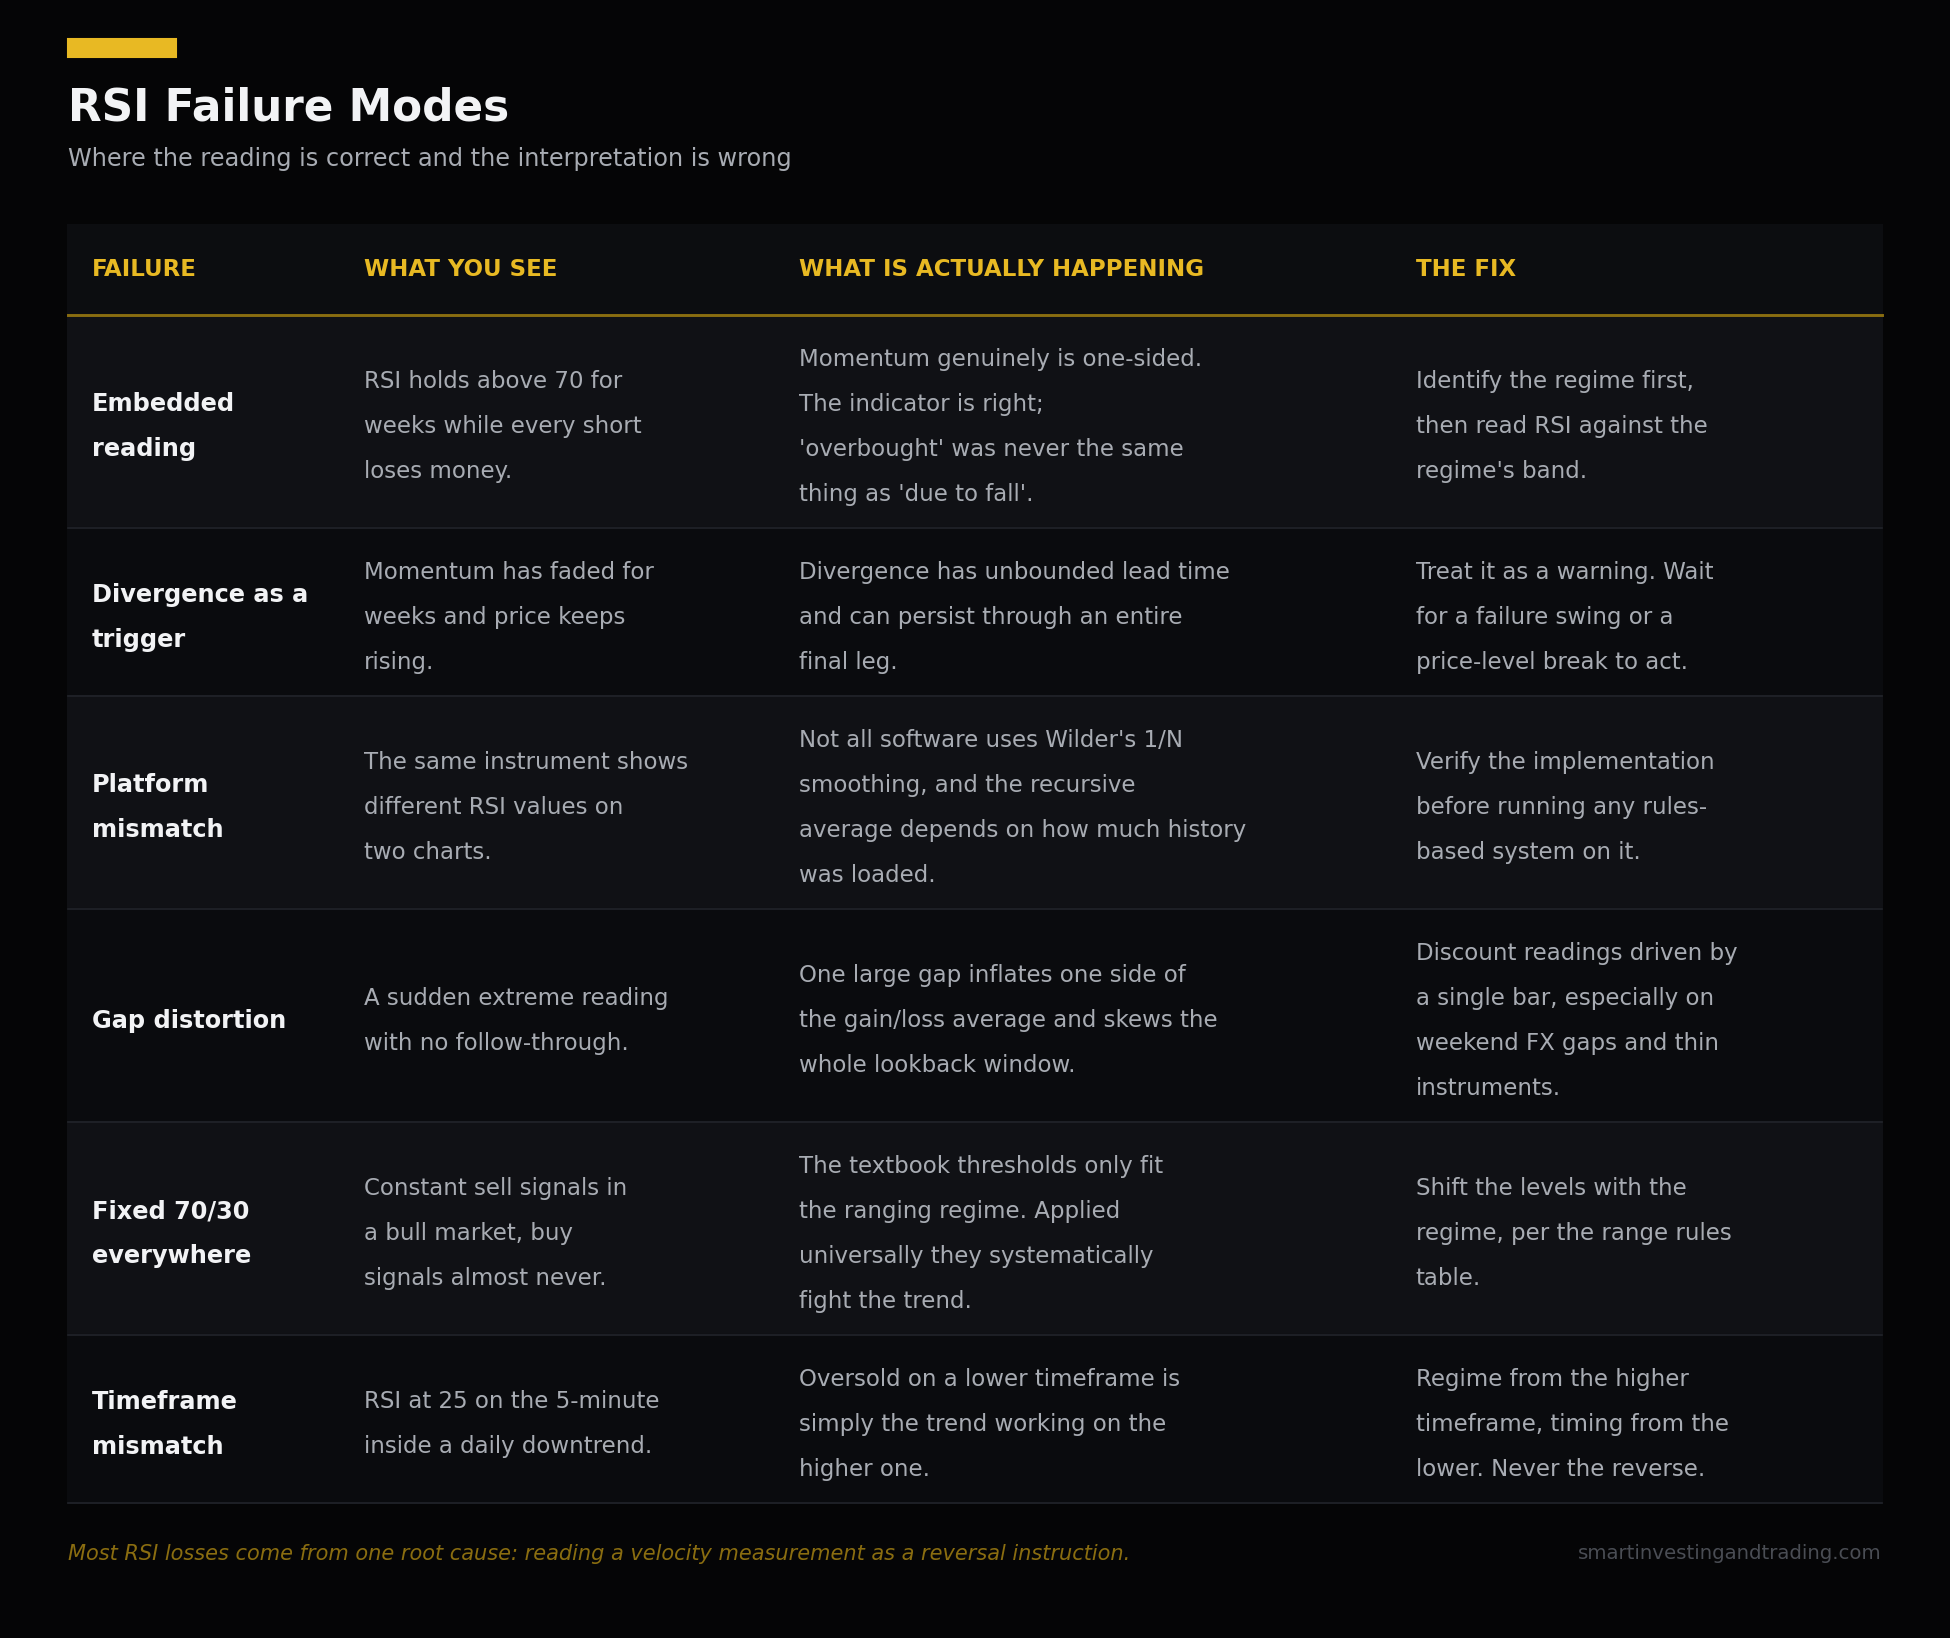
Embedded readings in a trend. The dominant failure. RSI holds above 70 for weeks in a strong advance. Every “overbought” short is a losing trade. The reading is correct — momentum genuinely is one-sided — the interpretation is wrong.
Divergence used as a trigger. Momentum fades before price turns, but the lead time is unbounded. Divergence can persist through an entire final leg. Wait for the structural break — the failure swing, or a price-level break — before acting.
Platform differences. Not all software uses Wilder’s smoothing. Some implementations use a simple or standard exponential average of gains and losses, producing visibly different values. Additionally, because Wilder’s smoothing is recursive, RSI values depend slightly on how much history the platform loaded before the visible window. Two charts of the same instrument on the same timeframe can show different RSI values. If you are running rules-based systems, verify your implementation.
Gaps and thin instruments. A single large gap inflates one side of the gain/loss average and distorts the reading for the entire lookback window. On illiquid instruments, or across weekend gaps in FX, the resulting extremes are artefacts of one bar rather than a real momentum condition.
Timeframe mismatch. RSI at 25 on a 5-minute chart inside a daily downtrend is not an oversold buy. Establish the regime on the higher timeframe, then use RSI on the lower one for timing within it.
Where it fits
RSI is a momentum and velocity tool. It cannot tell you the direction of the trend, the location of structure, or the state of volatility. That is what the tools in the Bollinger Bands, MACD and Fibonacci cluster are for.
A workable combination: trend and volatility state from the higher-timeframe structure and Bollinger width; direction and momentum regime from MACD; level from Fibonacci retracement or prior structure; and RSI as the confirmation that momentum at that level is behaving consistently with the trade you want to take — reaching support at 40 in an uptrend, stalling at 60 in a downtrend, or breaking a failure-swing structure at a turn.
Used that way, RSI stops being an overbought/oversold buzzer and becomes what Wilder actually built: a clean, bounded measurement of how one-sided recent trading has been. That number is genuinely useful. What you do with it is where the edge is.


Add comment