

SMA vs EMA vs WMA
Ask a room full of traders which moving average is best and you will get the same answer from most of them: the EMA, because it reacts faster and gives you signals sooner.
That answer is half wrong, and the half that is wrong is the half that costs money.
The three common moving averages — simple, exponential and weighted — are not three levels of quality with the EMA at the top. They are three different ways of distributing weight across the same window of prices. Each distribution has a cost. Understanding the cost is the whole point of this article, because once you see it, the choice stops being a matter of preference and starts being a matter of what you are actually trying to do with the line.
If you have not read the parent guide yet, start with what moving averages are and how to use them — this article assumes you already know what a moving average is and why it lags.
SMA vs EMA vs WMA – The short answer, before the detail
The lookback period matters far more than the type.
Switch a 20 SMA to a 20 EMA and the line moves slightly. Switch a 20 SMA to a 50 SMA and the line moves to a different part of the chart entirely, gives different signals, and turns a scalping tool into a swing tool. Traders spend hours arguing about SMA versus EMA and about ten seconds choosing the number, when the number is the decision that actually shapes their results.
So: pick the period first, deliberately. Then pick the type, and pick it for a reason you can state out loud.
SMA vs EMA vs WMA – What the three averages actually do
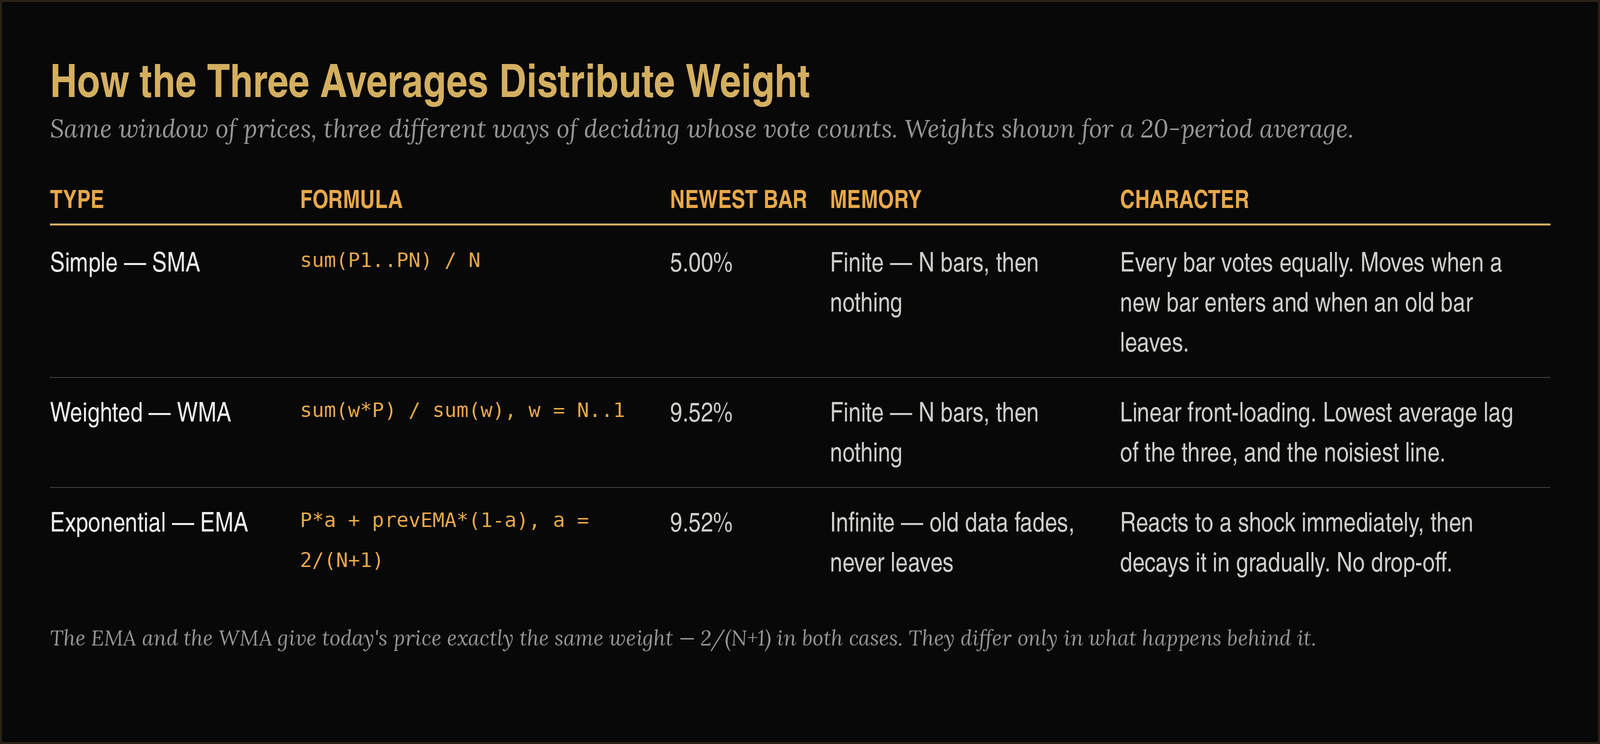
All three take the last N prices and produce one number. They differ only in how much say each of those prices gets.
Simple moving average (SMA)
Every price in the window gets an identical vote. A 20 SMA gives yesterday’s close and the close from nineteen days ago exactly the same 5% weight. Once a price falls out of the window, it has no influence at all.
Weighted moving average (WMA)
Weights fall off in a straight line. In a 20 WMA the newest bar gets a weight of 20, the one before it 19, and so on down to 1 for the oldest. Divide by the sum (210) and the newest bar carries 9.52% of the average. Like the SMA, it forgets completely once a bar leaves the window.
Exponential moving average (EMA)
Weights fall off geometrically and never quite reach zero. The formula is:
EMA = (Price × α) + (Previous EMA × (1 − α)), where α = 2 / (N + 1)
For a 20 EMA, α = 0.0952. The newest bar gets 9.52%, the bar before it 9.52% of what remains, and so on forever. Old data fades but never leaves.
[TABLE 1 — the three formulas and their weighting]
Two things in that table are worth stopping on.
First, the EMA and the WMA give the newest bar exactly the same weight. That is not a coincidence: the standard EMA smoothing factor 2/(N+1) is algebraically identical to the front weight of an N-period WMA. Whatever separates these two lines on your chart, it is not how they treat today’s price. They differ entirely in what they do behind it.
Second, the “20” in a 20 EMA is not a lookback at all. It is a label. Roughly 86.5% of a 20 EMA’s weight sits inside the last twenty bars — which means about 13.5% of the number you are looking at comes from prices older than the period you selected. An EMA has no window. It has a memory.
SMA vs EMA vs WMA – The lag myth
Here is the claim you see everywhere, including in the documentation of platforms that ought to know better: exponential moving averages have less lag than simple moving averages.
Measure it properly and that claim falls apart.
The correct measure of a filter’s lag is the centre of mass of its weights — the average age of the data inside it. John Ehlers, who came to markets from engineering, states it plainly in his technical papers: a moving average lags by the centre of gravity of its observation window, and smoothing versus lag is always a trade-off, never a free gain.
Run the arithmetic:
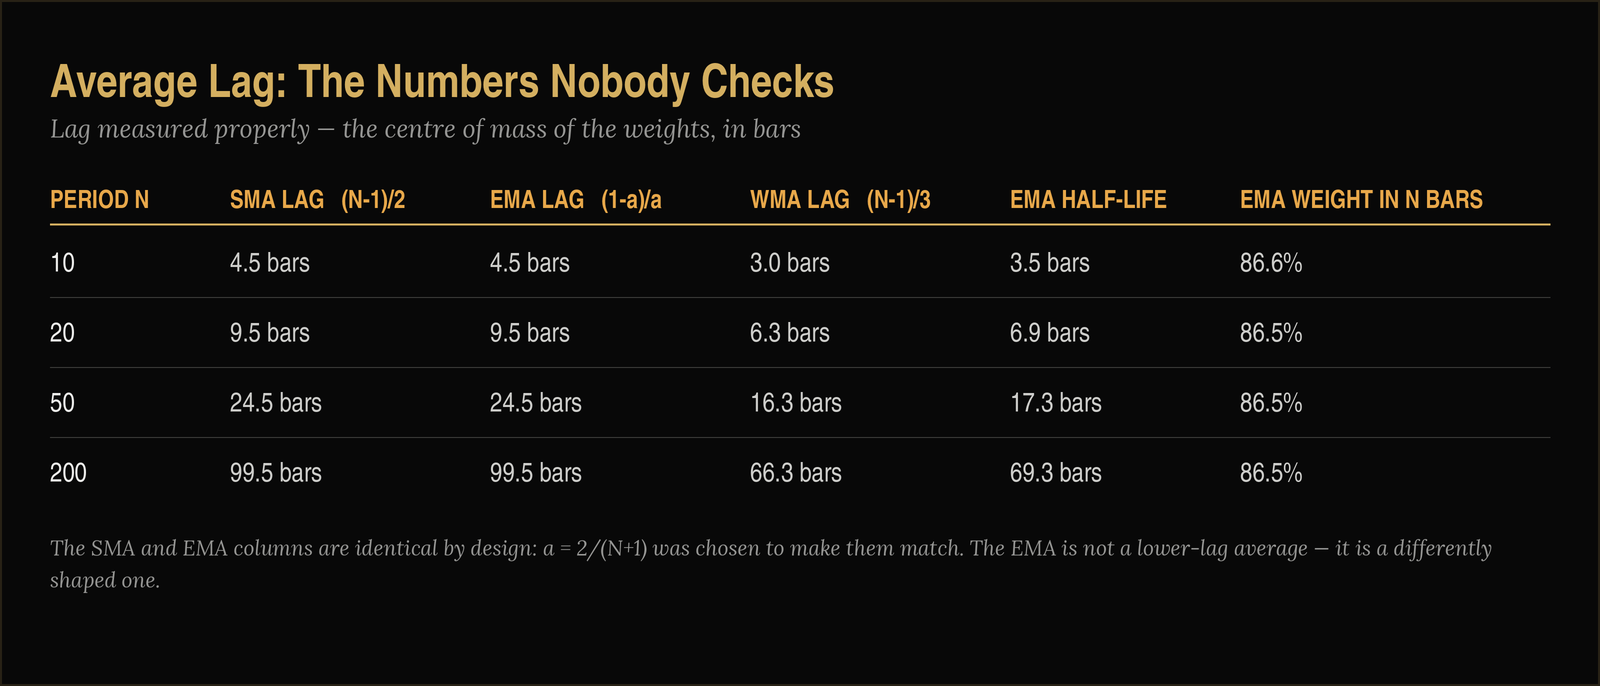
- SMA of N periods: centre of mass = (N − 1) / 2
- EMA with α = 2/(N + 1): centre of mass = (1 − α) / α = (N − 1) / 2
- WMA of N periods: centre of mass = (N − 1) / 3
SMA vs EMA vs WMA
The 20 SMA and the 20 EMA have identical average lag: 9.5 bars each. That is not an approximation — the conventional α of 2/(N+1) was chosen precisely so that an N-period EMA would match an N-period SMA in average age of data. The standard smoothing factor exists to make them equivalent.
[TABLE 2 — lag comparison at 10, 20, 50 and 200 periods]
The genuinely faster line in that table is the one nobody talks about. A 20 WMA carries an average lag of 6.33 bars against 9.5 for the other two. At 200 periods the gap is 66 bars against 99.5. If raw responsiveness were the only criterion, the WMA would win every argument.
So why does the EMA feel faster?
Because average lag is not the same thing as reaction to a shock. Half of a 20 EMA’s weight sits in the last seven bars, so when price gaps or spikes, the EMA reflects a large chunk of that move immediately and then decays the rest in gradually. The SMA absorbs the same shock as one-twentieth of its value, holds it flat for twenty bars, and then jerks when it drops out. Same average lag, completely different texture. The EMA responds sooner but keeps a long tail; the SMA responds slowly but is done with the data on a fixed schedule.
Neither of those is “less lag.” They are different distributions of the same lag.
The drop-off effect: the SMA’s second engine
This is the part of simple moving averages that almost no retail course mentions, and it produces signals that look like information and are not.
An SMA changes for two reasons on every bar:
- A new price enters the window.
- An old price leaves it.
The change is (New price − Dropped price) / N. Both terms matter equally.
Which means a 50 SMA can turn down on a day the market went nowhere, purely because the bar rolling out of the back of the window was a high one. The line falls, the chart looks like it is rolling over, and the cause is an event from fifty days ago exiting the calculation. Traders read it as fresh weakness. It is stale data leaving the room.
You can see this most clearly after a sharp spike. Count forward N bars from the spike and you will very often find the SMA making an abrupt move in the opposite direction on that exact bar, with nothing in current price to justify it. This is also why SMAs of the same data at slightly different periods sometimes disagree violently for a few bars — they are dropping different history.
The EMA has no drop-off effect at all. Nothing ever leaves, so the line only ever moves because of what price is doing now. For anyone using a moving average as a dynamic support and resistance reference, that alone is a decent argument for the EMA: you want the level to move because the market moved, not because of an anniversary.
What is actually wrong with the WMA
If the WMA has the lowest lag of the three, why is it the least used?
Because the linear weighting buys its speed in the worst possible currency. Ehlers is blunt about it in his paper on windowing: weighted moving averages carry the phase distortion problems of exponential averages and the group-delay problems of simple averages, giving you, in his phrase, the worst of both. The abrupt cut-off at the end of the window (weight 1 one bar, weight 0 the next) makes it noisy in exactly the frequency ranges traders care about, and it still has a hard drop-off edge.
In practice the WMA is a fine tool if what you want is a fast line and you are prepared for a choppier one. It is not a secret weapon, and the extra responsiveness relative to an EMA is smaller than the noise it adds. It survives mostly inside other indicators — the Hull moving average is built from three WMAs, and the HMA Alan Hull — The Hull Moving Average is a much better use of weighted averaging than a raw WMA on its own.
The EMA’s quirk your broker won’t mention
Because an EMA is recursive, it needs a starting value. Different platforms seed it differently. Some use an SMA of the first N bars TradingCode — Exponential Moving Average in Pine Script and then switch to the EMA recursion. Others simply start with the first price. Some start from the very first bar in the data feed, which means the answer depends on how much history that feed contains.
Consequence: your 200 EMA may not be your broker’s 200 EMA, and neither may match the one in the chart your analyst friend posted.
The differences fade as data accumulates, but “fade” is not “vanish.” As a working rule you want at least three to five times the period in history before an EMA settles — around 600 to 1,000 bars for a 200 EMA. If you have just switched timeframes, loaded a new symbol, or you are looking at a chart that only holds 300 candles, treat a long EMA as approximate.
SMAs and WMAs have no such problem. They are finite: given the last N closes, everyone in the world computes the same number. That is a genuine, if unglamorous, advantage — and it is part of why the levels the whole market watches are simple averages.
SMA vs EMA vs WMA – The argument that beats all the maths
The 200-day and 50-day simple moving averages are quoted on financial television, printed in research notes, and coded into institutional screens. The golden cross and death cross that make headlines are defined on SMAs.
That matters more than centre-of-mass arithmetic. A moving average used as a support or resistance reference works partly because other participants are looking at the same line and acting near it. When your reason for drawing the line is that other people are watching it, you must draw the line they are watching. On a daily chart of an index or a major pair, that is the 200 SMA, not a variant you optimised.
When your reason is your own signal generation — a crossover system, a trend filter, a trailing reference — then no one else’s opinion is involved and you should choose whatever behaves best in your testing.
Those are two different jobs and they deserve two different answers.
SMA vs EMA vs WMA – So which one, and when
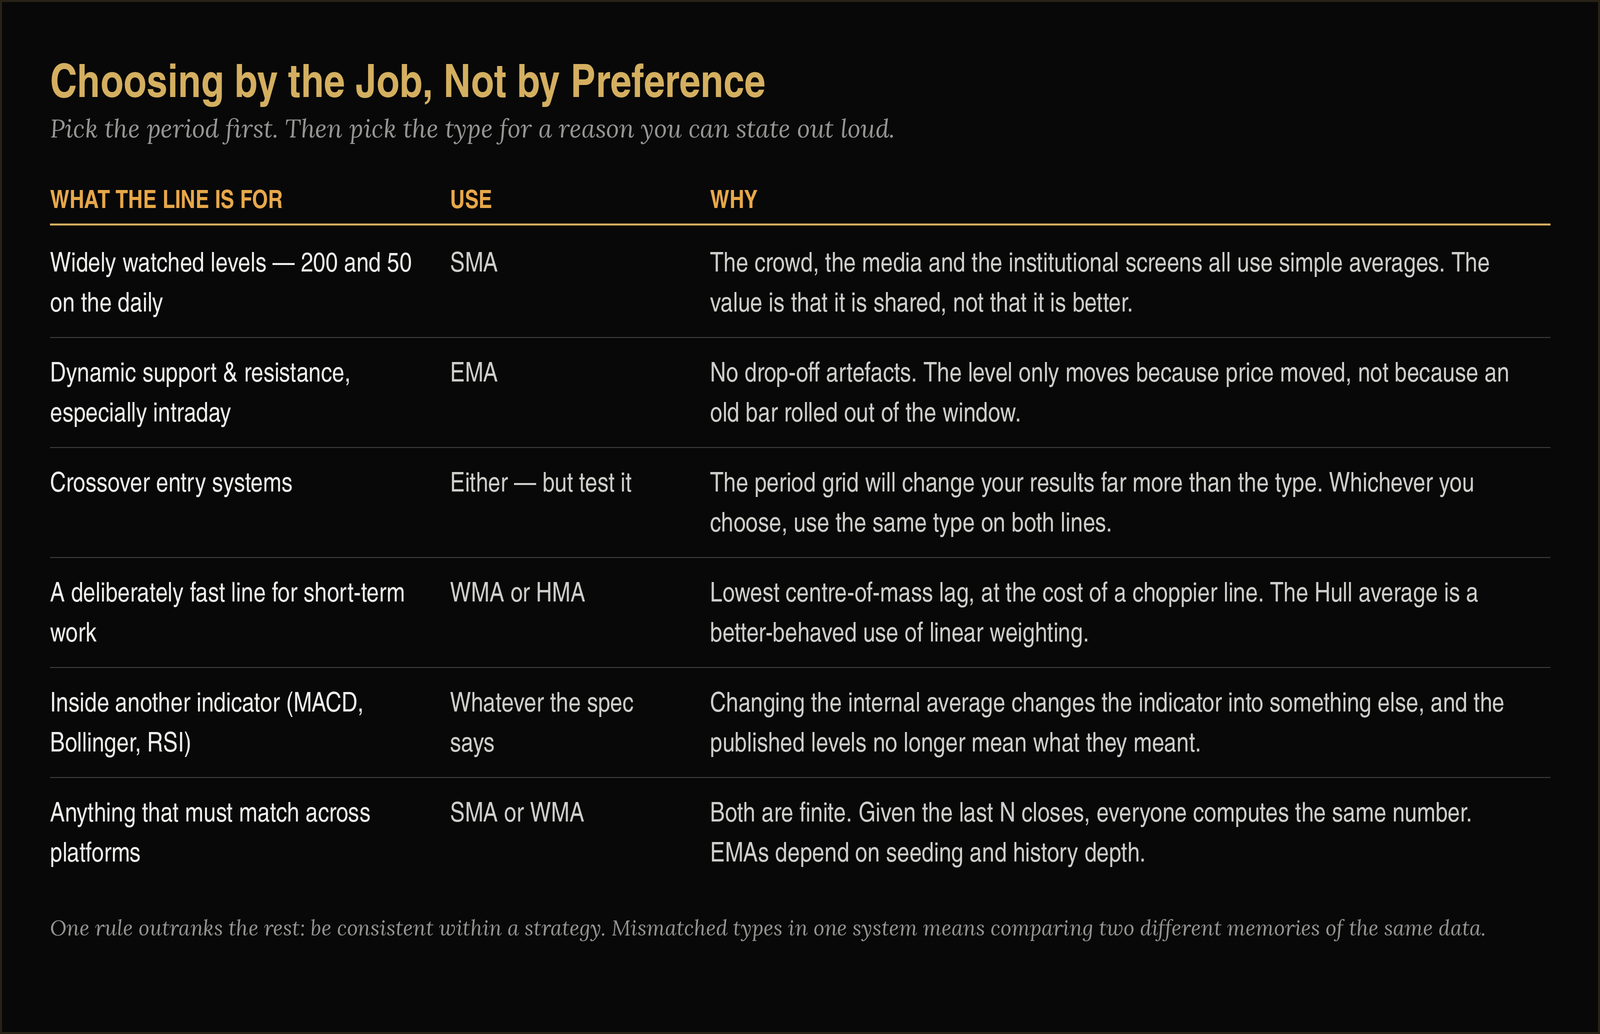
My own working defaults, for what they are worth after thirty-five years of doing this:
- Long-term trend and widely watched levels: SMA. 200 and 50 on the daily. Not because it is better, because it is shared.
- Intraday and dynamic support/resistance: EMA. No drop-off artefacts, smoother behaviour around the level, and short-term traders broadly use exponential lines so the crowd effect points the same way.
- Crossover systems: whichever you tested. But test the period grid before you test the type — the type will change your results by a rounding error and the period will change them completely.
- WMA: rarely, and usually only inside something else.
And one rule that outranks all of the above: use the same type consistently across a strategy. A system that fires on a 20 EMA crossing a 50 SMA is not combining strengths, it is comparing two differently-shaped memories of the same data. If you cannot explain why the mismatch is deliberate, make them match.
What this does not fix
None of these choices removes the fundamental problem. Every one of these lines is built entirely from prices that have already happened. None of them knows anything about the next bar. Shortening the period or switching to a faster type does not buy you foresight — it buys you earlier signals, most of which are wrong more often, which is the trade-off in its plainest form.
The reason to understand the differences is not to find the version that predicts. It is to stop misreading your own tools: to know that a falling SMA might just be old data leaving, that a 20 EMA is not a twenty-day average, and that “less lag” is usually a description of texture, not of timing.
FAQ
Is the EMA better than the SMA? Neither is better. They have the same average lag at the same period. The EMA reacts to new shocks sooner and never forgets old data; the SMA reacts on a fixed schedule and forgets completely. Choose by the job.
Why is 2/(N+1) the standard smoothing factor? Because it makes an N-period EMA match an N-period SMA in average age of data. It is a translation constant between two different weighting schemes, not a magic number.
Does a 20 EMA only use 20 bars? No. About 86.5% of its weight falls inside the last twenty bars; the rest comes from older data that never fully leaves the calculation.
Which moving average has the least lag? Of the three, the weighted moving average — its centre of mass is (N−1)/3 against (N−1)/2 for the other two. It pays for that with a noisier line and a hard cut-off at the back of the window.
Why does my platform’s EMA differ from another platform’s? Different seeding methods and different amounts of loaded history. Allow three to five times the period in bars before treating a long EMA as settled.
Should I mix SMAs and EMAs in one system? Only deliberately. Mixing types in a crossover means your two lines have different memory structures, which makes the signal harder to reason about and harder to test.
This article is educational and is not investment advice. Trading foreign exchange, futures, and other leveraged instruments carries a substantial risk of loss and is not suitable for every investor. Past performance is not indicative of future results. Test any method on your own data before risking capital.


Add comment