

A Complete Trading Guide (SMA, EMA, WMA)
Moving Averages
The one indicator almost every trader starts with
If you strip a chart back to a single line, the moving average is the line most traders draw. It sits under almost everything else in technical analysis: the middle Bollinger Band is a moving average, MACD is nothing but the difference between two moving averages, and a ribbon, an envelope and a crossover system are all just moving averages arranged differently.
That popularity is also the problem. Because it is the first indicator most people meet, it is also the one most people misunderstand. Two claims in particular get repeated everywhere and both are wrong:
- “A moving average predicts where price is going.” It does not. A moving average is a lagging calculation built entirely from prices that have already printed. It describes what has happened. Any forecasting value comes from the trader’s interpretation of that description, not from the line itself.
- “Short moving averages are just noise, so use long ones.” Length is not a quality setting. A 10-period and a 200-period moving average answer two completely different questions, and neither is more “correct” than the other. The mistake is asking a fast average a slow question.
Get those two things straight and the rest of this guide becomes much easier.
What a moving average actually is
A moving average is the average price of a market over a fixed number of bars, recalculated on every new bar. As the newest bar is added, the oldest one drops out of the window — which is why it moves.
That single operation does three useful things at once:
- It smooths. Random tick-by-tick noise is averaged away, leaving the underlying drift visible.
- It orients. The slope of the line tells you the direction of that drift, and price sitting above or below it tells you which side of the market has control.
- It gives you a reference point. A number you can measure current price against — which is where dynamic support and resistance, envelopes and mean reversion all come from.
That is the whole indicator. Everything else in this cluster is a variation on those three functions.
The three core types: SMA, EMA and WMA
All moving averages average price. They differ only in how they distribute weight across the lookback window.
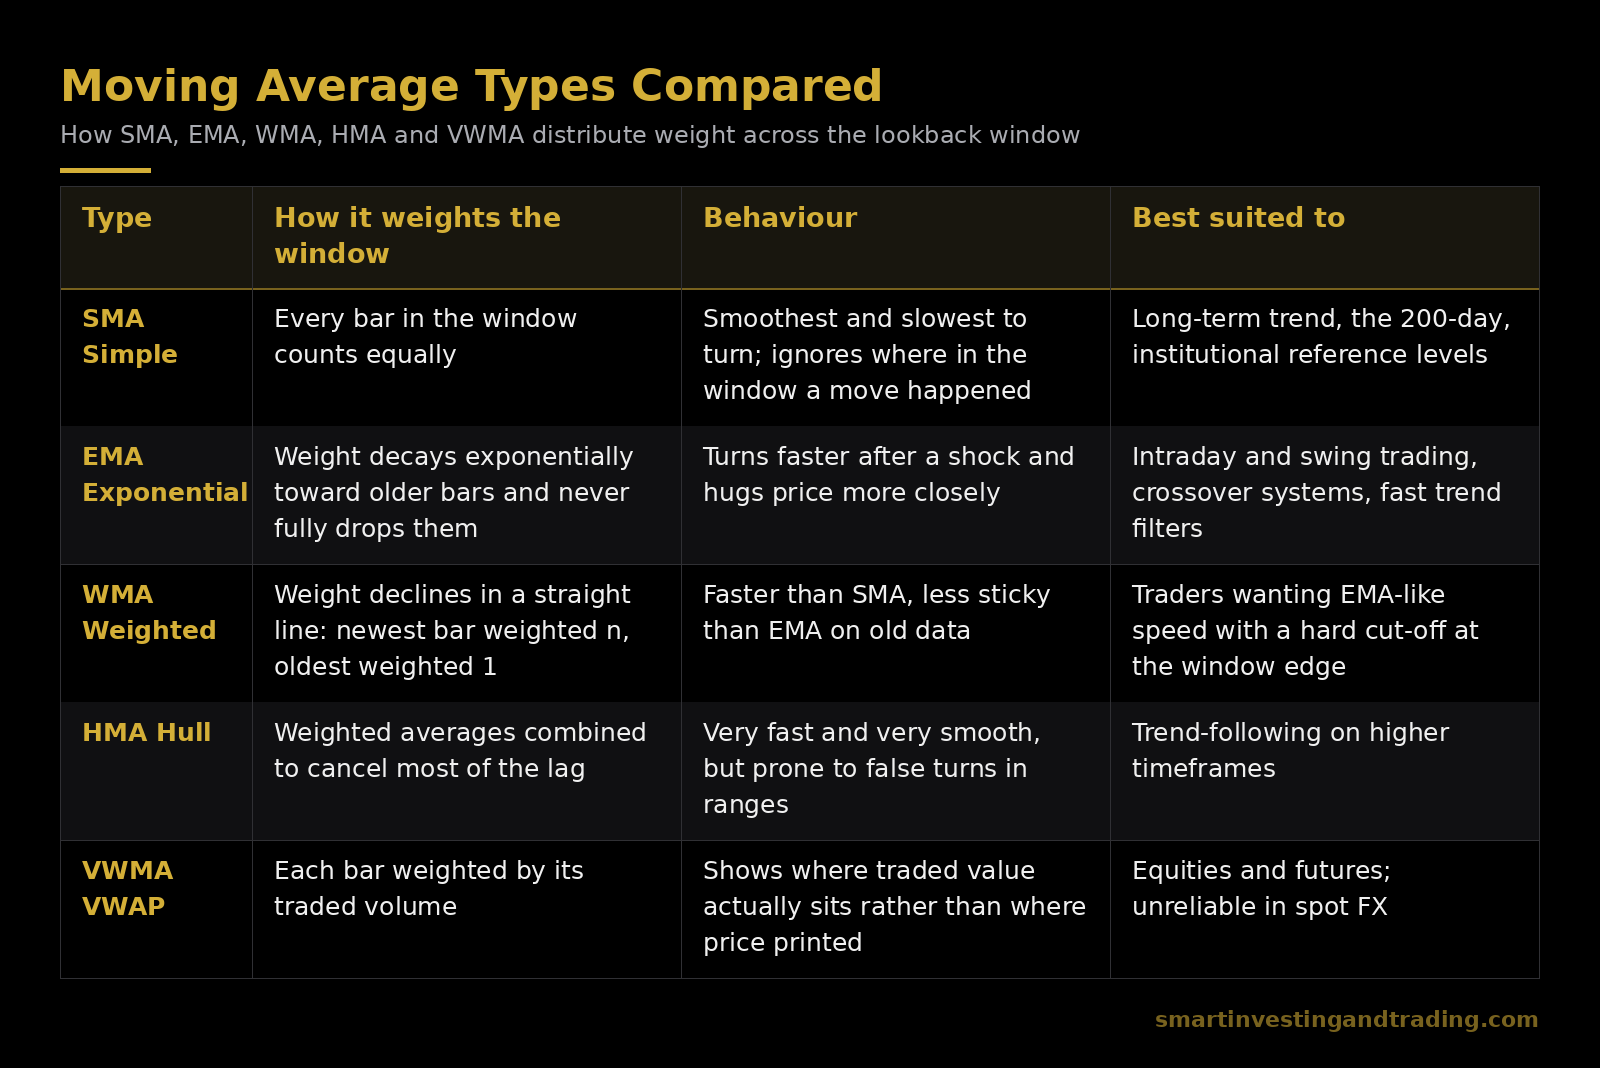
The formulas, worked examples and the practical test for which one to use are in the dedicated article: [SMA vs EMA vs WMA: Which Moving Average Should You Use?]
The short version: an EMA reacts sooner to a shock, but it is not “less lagging” in general. The centre of mass of both a 20-period SMA and a 20-period EMA sits roughly 9–10 bars back. The EMA simply front-loads its reaction. In a clean trend that helps. In a choppy range it just means you get whipsawed sooner.
An EMA is also the raw material for other indicators — [MACD is nothing more than the difference between two EMAs], which is why it inherits both the responsiveness and the lag of the averages underneath it.
Lag versus deviation — the distinction that matters
These two get confused constantly, including in a lot of published material.
Lag is the delay built into the calculation. An n-period average is centred roughly (n−1)/2 bars in the past. A 50-period average is describing conditions from about 25 bars ago. That is structural. You cannot remove it, only trade around it.
Deviation is how far current price has stretched away from the average right now. That is not lag — it is extension, and it is tradable information.
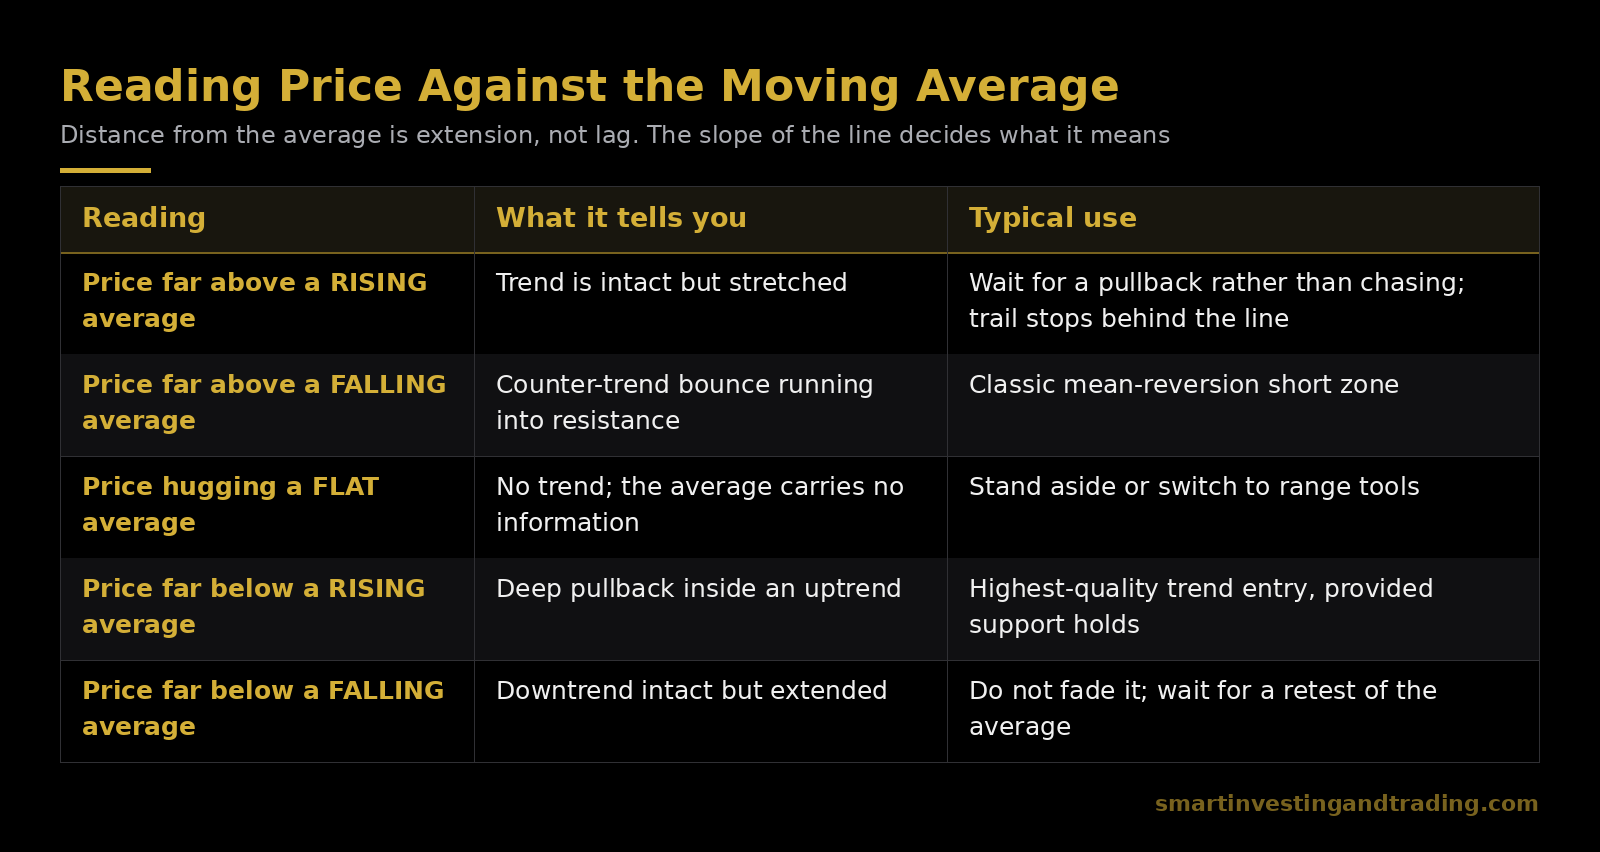
Notice the difference from the common advice. “Price is a long way above the average, so short it” is only half a rule. The slope of the average decides whether extension is an opportunity or a warning. Extended above a falling average is a fade. Extended above a rising average is usually just a trend that needs to breathe.
To measure extension properly you need bands, not eyeballs — which is what envelopes and Bollinger Bands exist for. Envelopes are covered in [How to Use Moving Average Envelopes in Trading], and the standard-deviation version in the [Bollinger Bands, MACD and Fibonacci pillar].
Moving Averages
Choosing your lookback period
There are no magic numbers. There are, however, numbers that thousands of traders watch simultaneously, which makes them behave as if they were magic. That self-fulfilling element is a real edge and there is no reason to fight it.
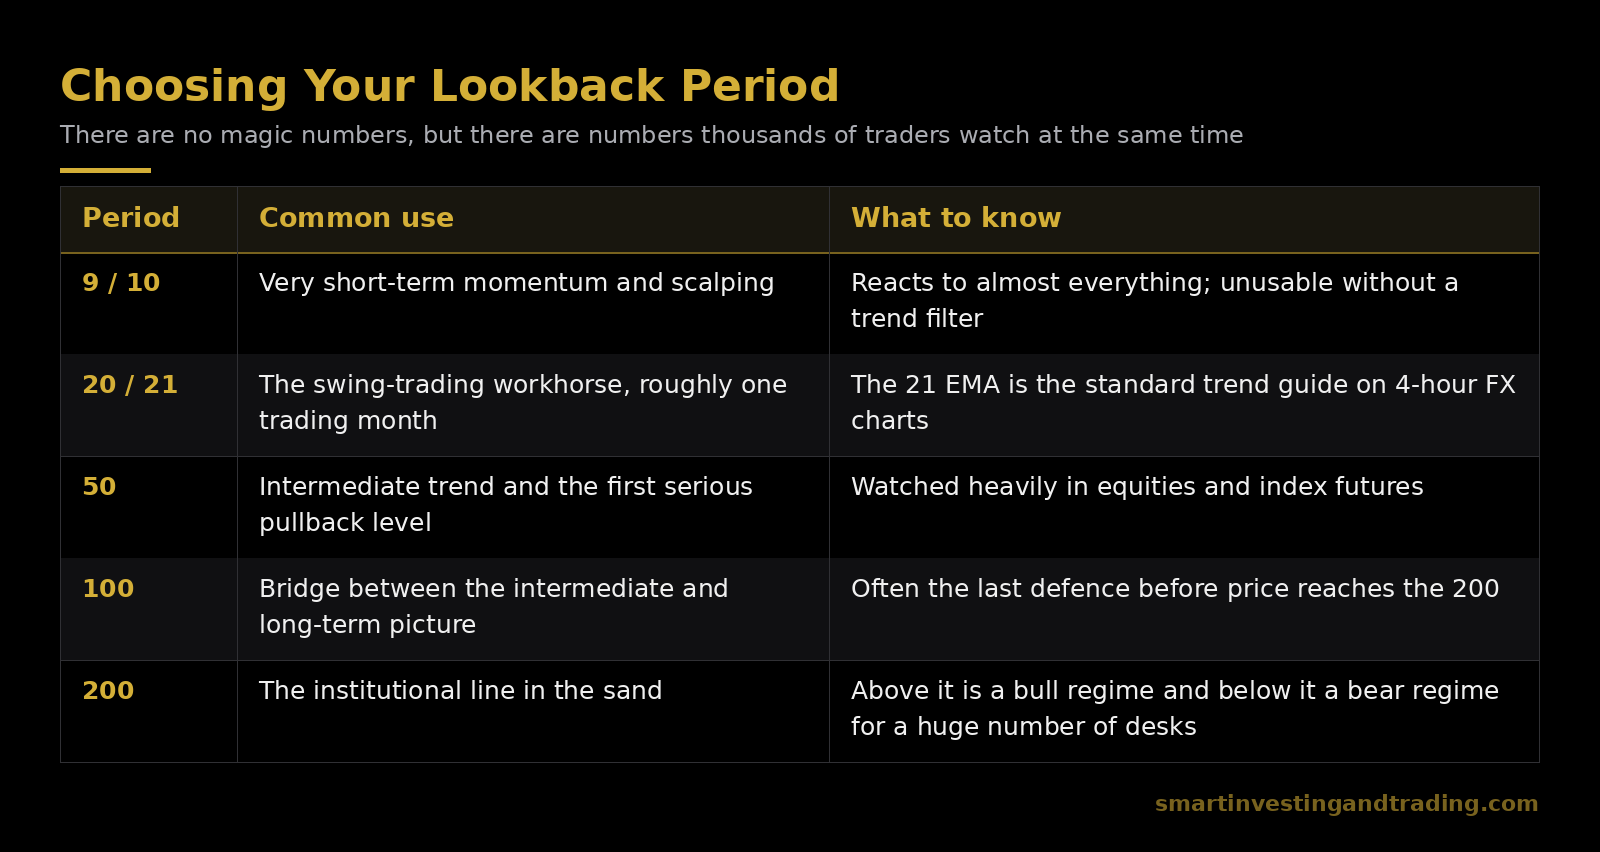
A few practical rules that will save you a lot of grief:
- Match the period to your holding time. If your average trade lasts three days, a 200-period average on a daily chart is background context, not a trade signal.
- Do not optimise to two decimal places. If a system works on a 50 but collapses on a 48 or a 52, you have curve-fitted, not discovered something.
- Keep your set small and consistent. Two or three averages you know intimately beat eight you half-watch.
The five ways traders actually use moving averages
Everything practical falls into one of these five. Each has its own article in this cluster.
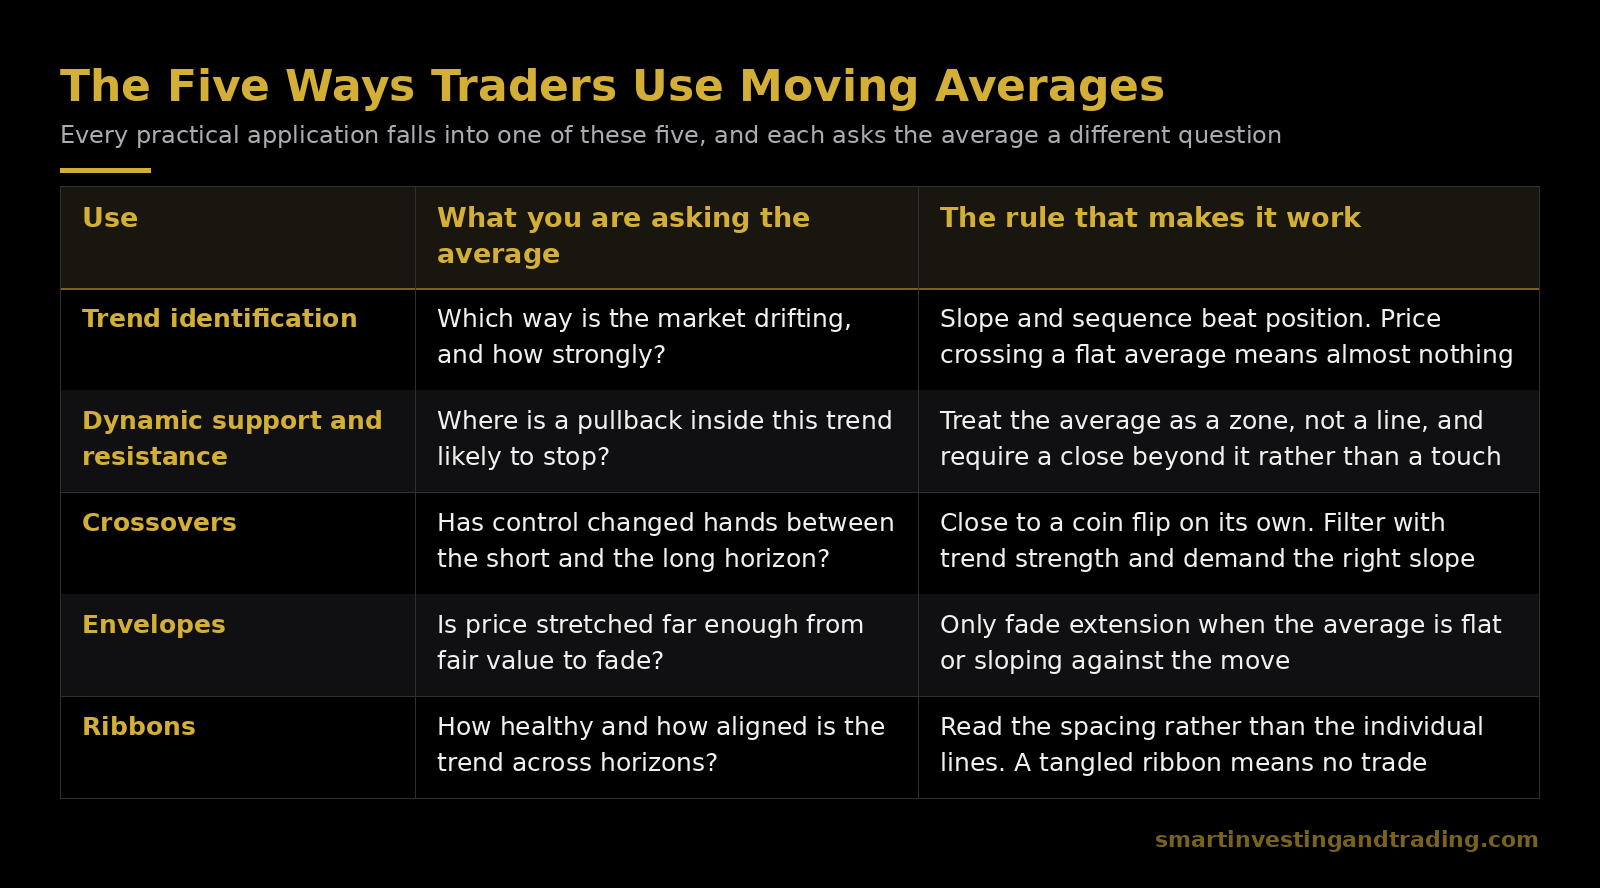
1. Trend
Three signals, in ascending order of reliability: price above or below the line; the slope of the line; and the sequence of several lines (fast above medium above slow is a stacked uptrend). Price crossing a flat average means very little. Price above a rising average that sits above a rising longer average means a great deal.
2. Dynamic support and resistance
In a trend, pullbacks tend to stall in the region of a widely watched average — the 21 EMA in fast trends, the 50 in more measured ones, the 200 when a whole regime is being tested. Treat these as zones, not lines. Price will routinely poke through by a fraction and reverse. Requiring a close beyond the average, rather than a touch, removes most of the false signals.
3. Crossovers
A fast average crossing a slow one is the most-used entry signal in existence, and on its own it is close to a coin flip. It works when the market is trending and bleeds money when it is not. The Golden Cross (50 above 200) and Death Cross (50 below 200) are the famous long-horizon versions. The child article covers the filters that make crossovers viable — trend confirmation, slope requirements and how to avoid taking every signal in a range.
4. Envelopes
Fixed-percentage bands drawn either side of an average. They give you an objective definition of “too far”, which is exactly what mean-reversion trading needs. Simpler than Bollinger Bands and, in markets with stable volatility, often more consistent.
5. Ribbons
Six or more averages plotted together. The information is not in any single line but in the spacing: expanding ribbons mean a strengthening trend, compressing ribbons mean it is running out of fuel, and a tangled ribbon means there is no trend to trade. The Guppy Multiple Moving Average is the best-known implementation.
Where moving averages fail
Every moving average system has the same failure mode: the sideways market. In a range, price oscillates around the average, generating a constant stream of crosses and touches, every one of which loses a little money. This is where most beginners give up on the indicator, usually concluding it “doesn’t work.”
It works fine. It is being asked the wrong question.
Practical defences:
- Filter with a trend-strength measure. ADX below roughly 20–25 is a good “do not take crossover signals” flag.
- Require slope, not just position. If the average is flat, no signal from it counts.
- Require a close, not a touch. Wicks through an average are noise more often than not.
- Watch the spacing. When your fast and slow averages sit on top of each other, the market is telling you there is no trend. Believe it.
- Confirm with something that is not a moving average. Momentum tools answer a different question and fail at different times — see the [oscillators pillar] for Stochastics, RSI, CCI and Williams %R.
One more warning worth stating plainly: because MACD, Bollinger Bands and most ribbons are all built from moving averages, stacking them does not give you independent confirmation. Three views of the same calculation agreeing with each other proves nothing. Genuine confirmation has to come from a different input — momentum, volume, volatility, market structure or the fundamental backdrop.
A workable framework
If you want a single approach to build on, this one has survived a lot of markets:
- Higher timeframe sets the bias. Price and the 200 on the daily decide whether you are hunting longs or shorts. Nothing else overrides this.
- Trading timeframe sets the trigger. A pullback into the 21 EMA or 50 SMA, in the direction of the bias, with the average sloping the right way.
- Price action confirms. A rejection candle, a failed break, a hold of a prior swing — some evidence that the zone is doing its job.
- The average manages the trade. Trail behind the line you entered on. Exit when price closes decisively through it or when the averages cross back.
- No trade when the averages are tangled. Flat and overlapping means stand aside.
That is not exotic and it is not supposed to be. Moving averages are context and discipline tools. They will not find you the top or the bottom. What they will do — used properly — is keep you on the right side of the market for the middle 60% of a move, which is where the money actually is.
Moving Averages Frequently asked questions
Which moving average is best? There is no best one. EMAs react faster and suit shorter timeframes; SMAs are smoother and suit long-term regime analysis. Consistency matters more than the choice.
What is the most reliable moving average setting? The 200-period on the daily chart is the most widely watched, which makes it the most self-fulfilling. For active trading, 20/21 and 50 are the common working pair.
Do moving averages work in forex? Yes, and arguably better than in equities, because FX trends are long and volume data is unreliable — which removes volume-weighted alternatives from the picture.
Are moving averages leading or lagging? Lagging, always. They are calculated from closed prices. Anyone selling you a “non-lagging” moving average has reduced the lag by weighting recent data more heavily, at the cost of more false signals.
How many moving averages should I use? Two or three for most systems. More than that and you are either building a ribbon deliberately or confusing yourself accidentally.
Moving Averages
Explore the cluster
- [SMA vs EMA vs WMA: Which Moving Average Should You Use?]
- [How to Use Moving Averages to Find the Trend]
- [How to Use Moving Averages as Dynamic Support & Resistance Levels]
- [How to Use Moving Average Crossovers for Trade Entries]
- [How to Use Moving Average Envelopes in Trading]
- [How to Interpret Trends with Moving Average Ribbons]
Brock, Lakonishok & LeBaron (1992), Journal of Finance
StockCharts ChartSchool — “Moving Averages: Simple and Exponential”


Add comment