

Bollinger Bands in Forex: What They Actually Measure
Bollinger Bands Forex
They are on more charts than almost any other overlay, and they are misread more often than almost any other overlay. The reason is a single sentence that appears in nearly every article written about them: price at the upper band is overbought, price at the lower band is oversold. John Bollinger has spent forty years saying this is wrong. It is still the first thing most traders are taught.
This article covers the tool properly — the construction, the statistics behind it, the two derivative indicators most traders never look at, and the specific quirks that show up when you apply it to currencies rather than stocks. It is the Bollinger Bands section of our complete guide to Bollinger Bands, MACD and Fibonacci, expanded into the detail the subject deserves.
What Bollinger Bands are
Bollinger Bands are volatility bands plotted around a moving average. John Bollinger developed them in the early 1980s, when the standard approach was a trading envelope of fixed percentage width — a line 3% above and 3% below a moving average, adjusted by hand when it stopped fitting. His insight was that volatility is not a constant, so the envelope should not be one either. Let the market set the width.
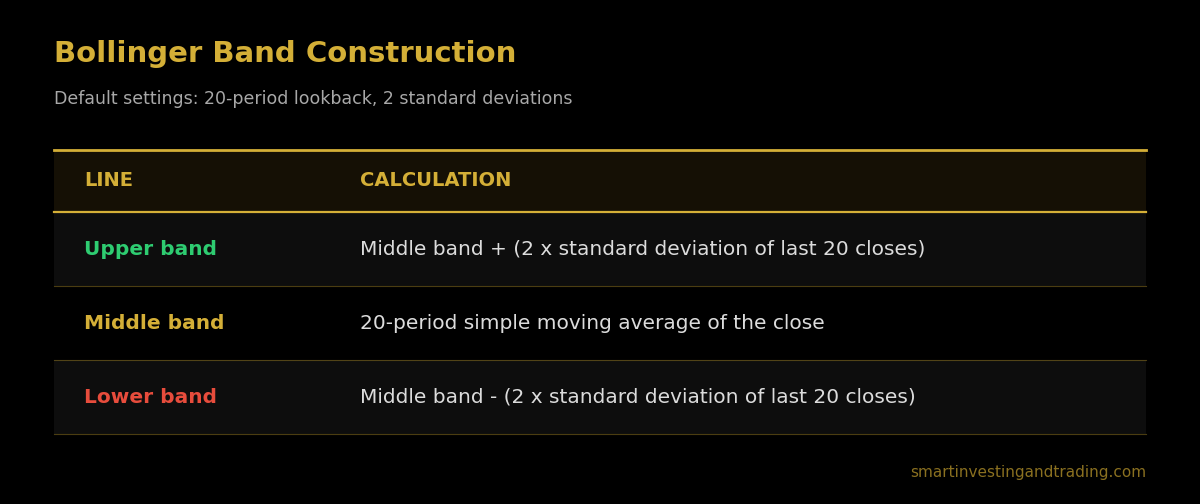
The construction has three components:
Bollinger Bands Forex
Three details in that table matter more than they look.
The average is simple, not exponential. This is not a stylistic preference. The standard deviation calculation is itself built on a simple average of the lookback window. Centring the bands on an EMA while deriving their width from an SMA gives you an upper and lower band that are not mathematically consistent with the line they are drawn around. Some platforms offer an EMA option. Leave it alone.
The lookback for the deviation is the same as the lookback for the average. Twenty closes feed both. Platforms that let you set them separately are offering you a way to break the tool.
The middle band is not decoration. Recycled articles describe it as “a line running somewhere near the middle.” It sits exactly in the centre by construction, and it is a working line in its own right — in a healthy trend, the first pullback usually finds its floor there. Bollinger describes the middle band as the definition of the intermediate-term trend, and that is how it behaves.
One technical footnote for anyone coding this themselves: Bollinger specifies the population standard deviation, dividing by n. Several statistics libraries default to the sample form, dividing by n−1, which produces marginally wider bands. On a 20-period window the difference is small but real, and it is enough to make your backtest disagree with your chart.
Bollinger Bands Forex – The 95% myth
Here is the claim you will find repeated across the internet, including on sites that ought to know better: two standard deviations capture roughly 95% of price action.
That figure is borrowed from the normal distribution, and financial returns are not normally distributed. They have fat tails, they cluster, and the extremes arrive in groups rather than evenly spaced. On real price data, 2SD bands contain closer to 88–89% of closes. Part of that gap is distributional and part of it comes from calculating a deviation over a 20-period sample, but the direction of the error is what matters: the bands are breached more often than the textbook figure implies, and the breaches bunch up in exactly the conditions where you are most exposed.
Trade the 95% number and you will size positions as though excursions outside the bands are rare events. They are not rare, and they do not arrive one at a time.
A tag is not a signal
This is the correction that pays for itself.
The bands answer one question, and it is a narrow one: is price high or low relative to recent trading? By definition, price is high at the upper band and low at the lower band. That is a statement of relative position. It contains no information about direction.
Bollinger’s own rules are explicit on the point — a tag of the upper band is not in itself a sell signal, a tag of the lower band is not in itself a buy signal, and his full list of rules is worth reading in the original</a>. Two consequences follow.
Price walks the band. In a genuine trend, price will ride the upper band for days or weeks, tagging it repeatedly without any reversal. Every trader who shorted the first touch was stopped out somewhere in the second week. Walking the band is not an anomaly; it is what a strong trend looks like through this particular lens.
Closes outside the bands are continuation signals first. A close beyond the upper band means the market has moved further than its own recent volatility says it should have. The default reading of that is momentum, not exhaustion. Whole categories of volatility-breakout systems are built on precisely this behaviour.
Mean reversion off the bands does happen — in ranging markets, with confirmation, and typically with the bands themselves flat or narrowing. The mistake is treating the reversion case as the default and the continuation case as the exception. It is the other way around.
Bollinger Bands Forex
Settings, and why the defaults are the defaults
Bollinger’s recommendation is 20 periods and 2 standard deviations. If you change the lookback, the multiplier has to move with it to keep containment roughly constant:
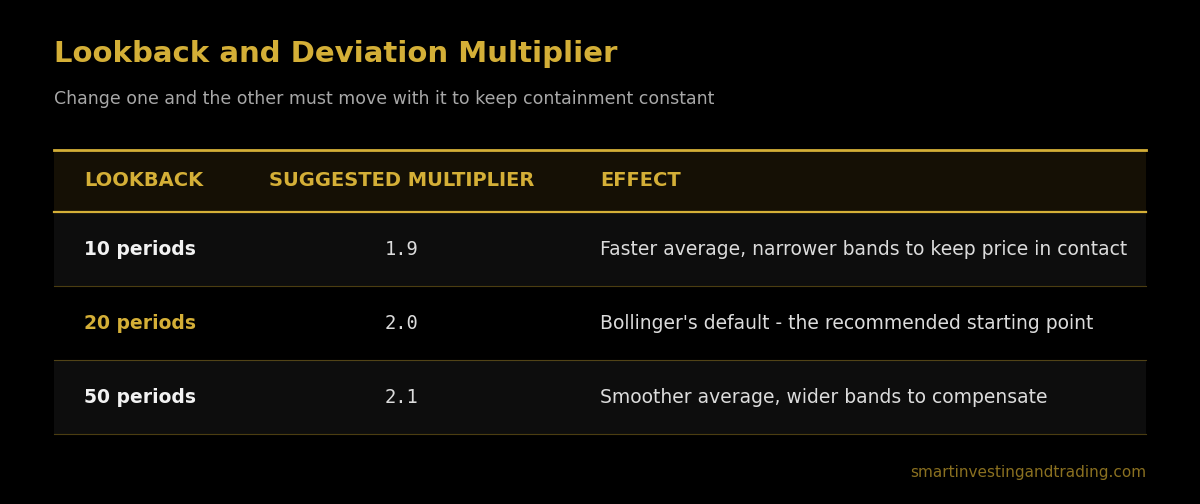
The logic is straightforward. A shorter window produces a jumpier average and a deviation that reacts faster, so a narrower multiplier keeps price interacting with the bands. Lengthen the window and the average smooths out while the deviation calculation stabilises, so the multiplier widens to compensate.
What you must not do is combine a short lookback with a wide multiplier. A 10-period average with 2.5SD bands produces an envelope price almost never reaches, which means the tool stops telling you anything at all. The old article that circulates on trading sites uses a 10-period, 2SD example without a word about any of this.
Bollinger’s advice on adjustment is worth taking literally: move in small increments, and once a setting suits the instrument, stop touching it. Re-optimising every few weeks is curve-fitting to noise, and you will never learn how any single configuration behaves because you will never keep one long enough.
A forex-specific complication. Currencies trade around the clock, so the “daily close” that feeds your 20-period average is an arbitrary line drawn by your broker’s server time. A broker closing at 17:00 New York and a broker closing at 00:00 GMT will give you two different 20-day SMAs, two different deviation calculations, and two visibly different sets of bands on the same pair. This matters if you trade off daily-chart band tags, and it matters a great deal if you are comparing your chart to someone else’s. Check your server time before you conclude that a level “held.”
Bollinger Bands Forex
The two indicators most traders never use
Bollinger derived two indicators from the bands, and both are more actionable than the bands themselves — because both turn a picture into a number you can test.
%b — where price sits inside the bands

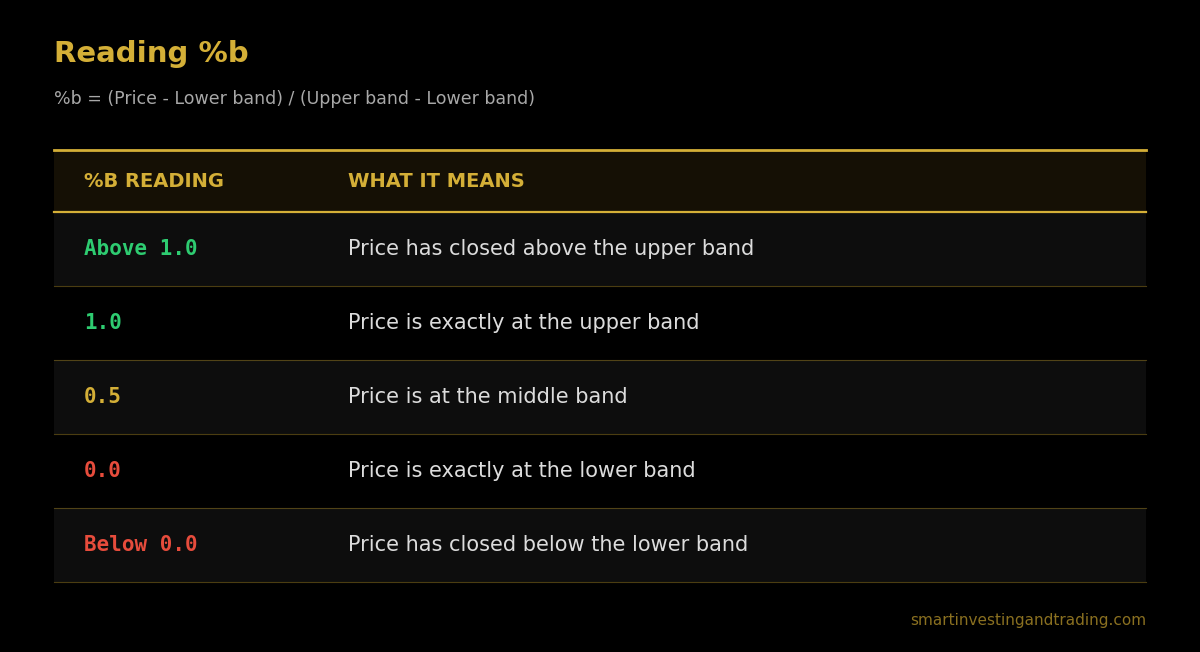
Because %b is a scalar, it can be screened, compared across instruments, and written into rules — none of which you can do with “price looks like it’s near the top.”
Its real use is comparison. If price makes a lower low but %b makes a higher low, the second low is less extreme relative to prevailing volatility than the first — the same logic as momentum divergence, but measured against the market’s own volatility rather than against a fixed oscillator scale.
BandWidth — how wide the bands are
BandWidth = (Upper band − Lower band) / Middle bandThis is the volatility reading with price position stripped out. Falling BandWidth means contracting volatility; rising BandWidth means expansion. The BandWidth reference</a> covers the standard applications.
Do not import stock-market thresholds into forex. You will see the rule of thumb that BandWidth below 4% counts as narrow. That is calibrated to equities. Major currency pairs are far less volatile than individual stocks — daily BandWidth on EUR/USD frequently sits in the 1–2% range in normal conditions, which would register as a permanent squeeze under the equity threshold. Use a relative measure instead: is BandWidth at a three- or six-month low for this pair, on this timeframe? That question travels between instruments. A fixed percentage does not.
The Squeeze, and the head fake
When BandWidth contracts to a multi-month low, the market is coiling. Bollinger named this the Squeeze, and it is the most reliable thing the bands do — with one enormous caveat.
The Squeeze tells you when, not which way. Volatility clusters: quiet periods are followed by active ones and active periods by quiet ones. A Squeeze is a statement that the quiet phase is mature, nothing more. It carries no directional information whatsoever, and any article that tells you a squeeze is bullish or bearish has invented that part.
Worse, the first move out of a Squeeze is frequently the wrong one. Bollinger calls this the head fake: price breaks one way, takes out the obvious stops sitting just outside the range, then reverses and runs in the opposite direction. In FX this is compounded by session structure — a break during thin Asian liquidity that reverses when London arrives is a head fake with a timestamp on it.
Practically, that means the Squeeze is a setup to prepare for, not a signal to take. Have both sides mapped. Wait for the expansion to confirm — BandWidth actually rising, price holding beyond the band rather than closing back inside — and size the position on the assumption that you may have to reverse. This is one of the places where position sizing and stop placement do more for your results than the entry ever will.
W-bottoms and M-tops
Bollinger adapted these from Arthur Merrill’s pattern work, and they are the cleanest reversal application the bands offer.
A W-bottom is a double bottom where the relative position of the two lows differs from their absolute position. Price makes a low outside or near the lower band, rallies, then makes a second low that is lower in price but sits inside the lower band — %b higher on the second low than the first. The market fell further while its own volatility envelope fell further still. That divergence between price and relative position is the signal; the absolute double bottom on its own is not.
An M-top is the mirror image. Second high above the first in price, but inside the upper band and with a lower %b. Strength that is fading relative to volatility, even as the price prints a new high.
Confirmation in both cases comes from the middle band. Until price closes through the 20-period average and holds, you have a pattern and not a reversal.
Confirming with something that isn’t correlated
Bollinger’s rule on confirmation is specific and routinely ignored: if you use more than one indicator, they must not be directly related to each other.
Bollinger Bands are built from a moving average. So is MACD. So are the great majority of trend and momentum overlays. Stacking them and waiting for agreement is not confirmation — it is the same information, redisplayed, generating a false sense of consensus. (The MACD article in this series goes into what that indicator does and does not measure.)
Useful confirmation comes from a different data source entirely:
- Volume-based measures — Money Flow Index, Chaikin Money Flow. Note that spot forex has no consolidated volume, so this means tick volume or futures volume as a proxy, both of which are approximations with known limitations.
- Positioning and sentiment — the CFTC Commitments of Traders report, retail positioning data from brokers that publish it.
- Intermarket data — yield spreads for the pair in question, which for most majors are the single strongest fundamental driver.
- Price structure itself — where the swing highs and lows actually sit, independent of any calculation. If you want the foundation for that, start with price action and trend structure.
The combination Bollinger himself has published as a starting point pairs %b with the Money Flow Index — a momentum thrust confirmed by a money-flow surge. It is a template to build on, not a system to run unmodified.
Five ways traders lose money with Bollinger Bands
- Shorting the upper band in a trend. The single most expensive error in technical analysis. A tag is a tag.
- Assuming 95% containment. The real figure is nearer 88–89%, and the breaches cluster.
- Trading the Squeeze directionally. Volatility compression says when, never which way.
- Confirming bands with MACD. Two moving-average derivatives agreeing is one opinion, not two.
- Re-optimising settings every month. You cannot learn an instrument’s personality through a configuration you keep replacing.
Bollinger Bands Forex
Frequently asked questions
Does price at the upper Bollinger Band mean sell? No. The bands define high and low relative to recent trading, not direction. In a trend, price walks the upper band for extended periods, and a close outside the band is a continuation signal before it is anything else.
What are the best Bollinger Band settings for forex? Start at 20 periods and 2 standard deviations, the defaults Bollinger specifies. If you shorten the lookback to 10, reduce the multiplier to around 1.9; if you lengthen it to 50, raise it to around 2.1. Then leave the settings alone long enough to learn how they behave on your pair.
What standard deviation should Bollinger Bands use? Two, paired with a 20-period lookback. The multiplier and the lookback must move together — changing one without the other breaks the containment the tool depends on.
Do Bollinger Bands really contain 95% of price? No. That figure assumes a normal distribution. Actual price data produces roughly 88–89% containment at 2SD, with the exceptions clustering during high-volatility periods.
Who invented Bollinger Bands? John Bollinger, CFA, CMT, in the early 1980s. He also derived the two companion indicators, %b and BandWidth.
Can Bollinger Bands be used on any timeframe? Yes, provided the bars carry enough activity to represent real price formation. On very short intraday charts in illiquid sessions, the bands describe the spread and the order book more than they describe the market.
Bollinger Bands Forex – The short version
Bollinger Bands measure one thing: where price sits relative to its own recent volatility. They do not measure direction, they do not predict reversals, and they do not contain 95% of anything. Used as a relative framework — with %b to make the reading testable, BandWidth to time the volatility cycle, and something genuinely uncorrelated to confirm — they are among the most useful tools on a chart. Used as an overbought/oversold oscillator, they are a reliable way to be short in an uptrend.
Trading foreign exchange on margin carries a high level of risk and is not suitable for all investors. Nothing in this article constitutes investment advice.


Add comment