

MACD in Forex: What the Lines Actually Measure, and Why the Numbers Don’t Mean What You Think
MACD Forex
Moving Average Convergence Divergence is the most widely misdescribed indicator in retail trading, and the misdescriptions start at the formula. Search the term and you will find articles that invert the subtraction, articles that call the histogram a momentum reading, articles that treat a zero-line cross as a distinct signal from a moving average crossover, and — almost universally — articles that quote MACD levels as though a reading of 0.0015 meant something you could carry from one chart to the next.
None of that survives contact with the arithmetic. This article covers the indicator properly: the construction, what each of the three signals is definitionally equivalent to, the settings its creator actually recommended (which are not 12-26-9 in the way you’ve been told), the specific scaling problem that makes MACD levels meaningless in a currency portfolio, and the award-winning fix for it that most retail traders have never heard of.
It expands the MACD section of our complete guide to Bollinger Bands, MACD and Fibonacci, and it is the companion to our corrected guide to Bollinger Bands in forex.
What MACD is
Gerald Appel developed Moving Average Convergence/Divergence in the late 1970s. The name is a literal description of what it does: it tracks whether two moving averages are converging or diverging, and by how much.
Three components, in this order:
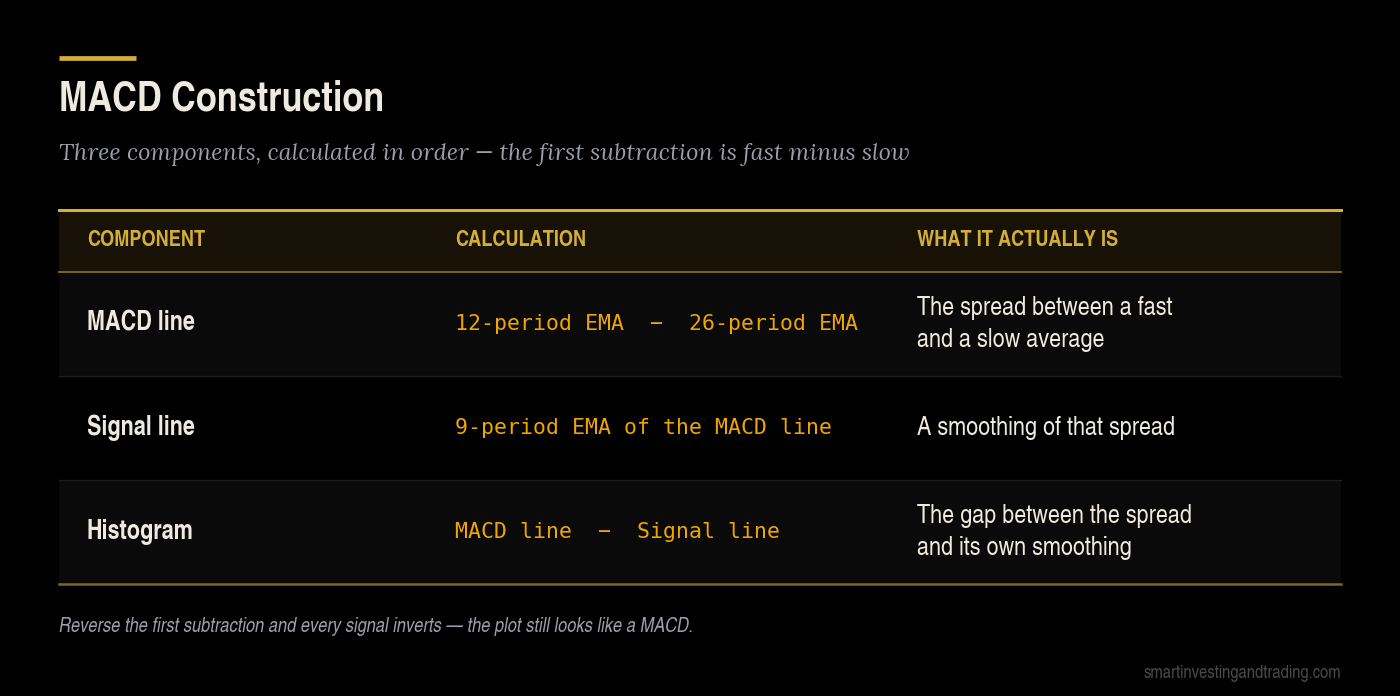
The order of the subtraction is fast minus slow. Twelve minus twenty-six. Not the reverse. This sounds too obvious to state, but the inverted version appears in published articles, in translated broker material, and in more than one indicator script on public platforms. If you get it backwards, every signal inverts and the indicator becomes a contrarian tool without anyone noticing — because a plot that is upside down still looks like a MACD.
The histogram is MACD minus signal. It is not momentum, it is not the rate of change of price, and it is not a measurement of buying pressure. It is the vertical distance between two lines on the subpanel below your chart.
The histogram was not Appel’s. Thomas Aspray added it in 1986, publishing his work in Technical Analysis of Stocks & Commodities. Aspray had presented his own work on the MACD at a CompuTrac conference in 1984, and noted that the indicator’s signals lagged badly on weekly data. His stated purpose was narrow and specific: the histogram was built to anticipate signal line crossovers in MACD, because moving averages lag price and the crossovers therefore arrive late enough to damage the reward-to-risk of a trade. It was designed as an early warning for one particular event, not as a general-purpose strength meter.
That distinction matters for how you read it, and we’ll come back to it.
MACD Forex What the three signals actually are
Most MACD articles present four signals — zero-line cross, signal-line cross, histogram flip, divergence — as though they were four independent pieces of information. Three of them are the same information stated three ways.
The zero-line cross is a moving average crossover
The MACD line equals the 12 EMA minus the 26 EMA. It crosses zero at the exact moment those two averages cross each other. Not around then. At that bar, definitionally.
So if you are running a 12/26 EMA crossover system and also watching the MACD zero line for confirmation, you are confirming a signal with itself. This is worth understanding rather than memorising, because once you see it, a whole category of “multi-indicator confluence” collapses.
What the zero line is good for is regime classification. Above zero, the fast average is above the slow one — the market has been in a trending posture. In forex, where major pairs can hold a direction for months at a time, using the zero line as a directional filter and taking signals only in that direction is a defensible use of the tool. It is not a confirmation of anything else you’re doing.
The signal-line cross is the histogram changing sign
The histogram is MACD minus signal. It is positive when the MACD line is above its signal line and negative when it is below. So the histogram crosses zero at exactly the bar where the MACD line crosses the signal line. Again — the same event, drawn twice.
The reason the histogram is genuinely useful is not the sign change but the slope. A histogram that is still positive but shrinking three bars in a row tells you the MACD line is converging on its signal line and a cross is approaching. That is the early warning Aspray designed it for. The sign change itself is old news by the time it prints.
Divergence, honestly
StockCharts makes the structural point plainly: MACD is an indicator of an indicator, which makes the histogram four steps removed from price — the fourth derivative of the underlying.
Take that seriously before you build a system on histogram divergence. You are comparing the shape of a fourth-order transformation of price against price itself and treating disagreement as information. Sometimes it is. Often it is an artefact of the smoothing windows — a shorter, sharper second push produces a lower MACD peak than a longer, shallower first push even when the second push is stronger in every way that matters, purely because the EMA had less time to accumulate the move.
The practical position: divergence is a reason to reduce size, tighten a stop, or stop adding to a position. It is not a reason to enter against a trend. A trending currency pair will produce four or five consecutive divergences on the way to its actual high, and each of the first four will be a losing short.
The settings question, and what Appel actually recommended
The 12-26-9 defaults are treated as scripture. The usual story is that 12 represented two weeks and 26 one month back when markets traded six days a week. That story is repeated everywhere and confirmed by nobody who was in the room; treat it as folklore rather than history.
What is documented is more interesting, and almost never mentioned in retail articles: Appel did not recommend a single symmetric setting. In his own writing he laid out a scheme using different MACD combinations for entries and exits, on the reasoning that you want to be quick to buy and slow to sell in a strong market:
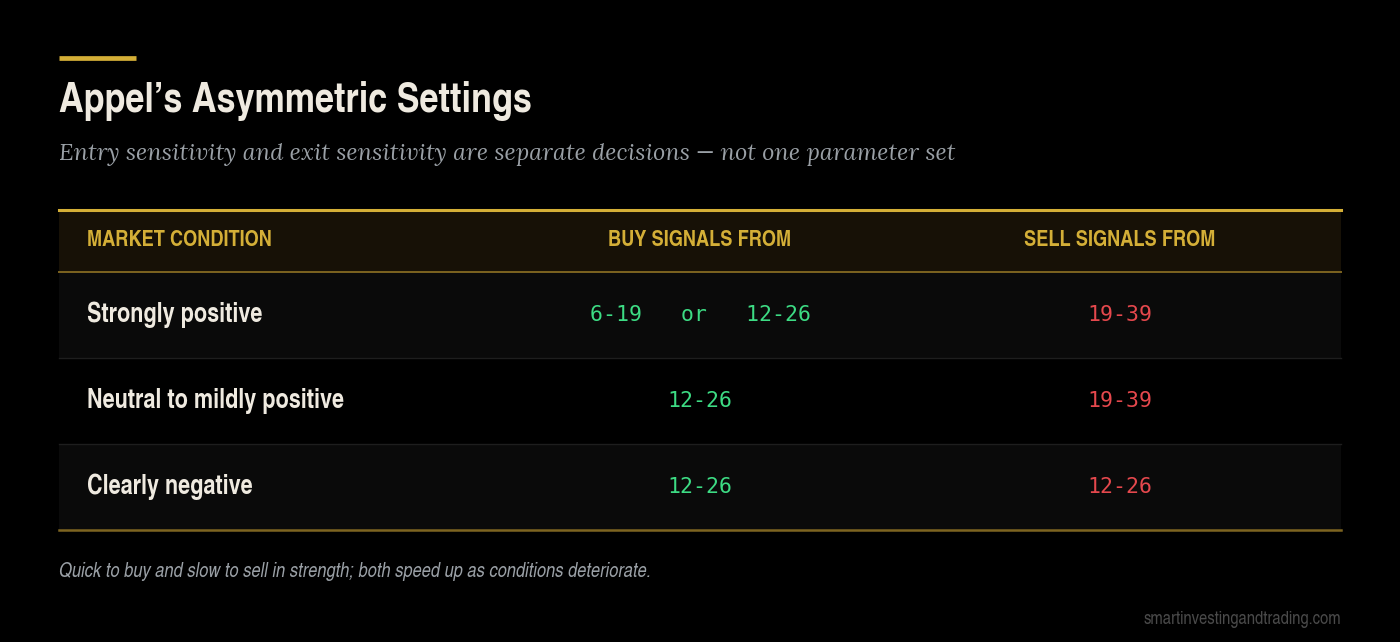
The logic is asymmetric on purpose. In an uptrend, a fast MACD gets you in early and a slow MACD keeps you from being shaken out by the first pullback. As conditions deteriorate, the exit setting speeds up to match the entry. Whether you adopt this specific scheme matters less than the underlying idea, which is that entry sensitivity and exit sensitivity are separate decisions and there is no reason a single parameter set should serve both.
Almost every retail treatment of “best MACD settings” ignores this entirely and argues about whether 5-35-5 beats 8-17-9 on a five-minute chart.
On optimisation generally: if you are going to tune the periods, tune them against a defined market and a defined holding period, walk them forward, and expect the improvement to be smaller than your backtest suggests. Faster settings do not give you earlier signals for free. They give you earlier signals and more false ones, and the ratio between the two is the only thing worth measuring.
MACD Forex The forex-specific problems
MACD values are in price units, so they don’t compare
This is the big one, and it is the reason MACD levels are quoted so rarely and so uselessly.
The MACD line is a difference between two prices. Its output is therefore denominated in the instrument’s own price scale. Consider what that does across a normal currency watchlist:
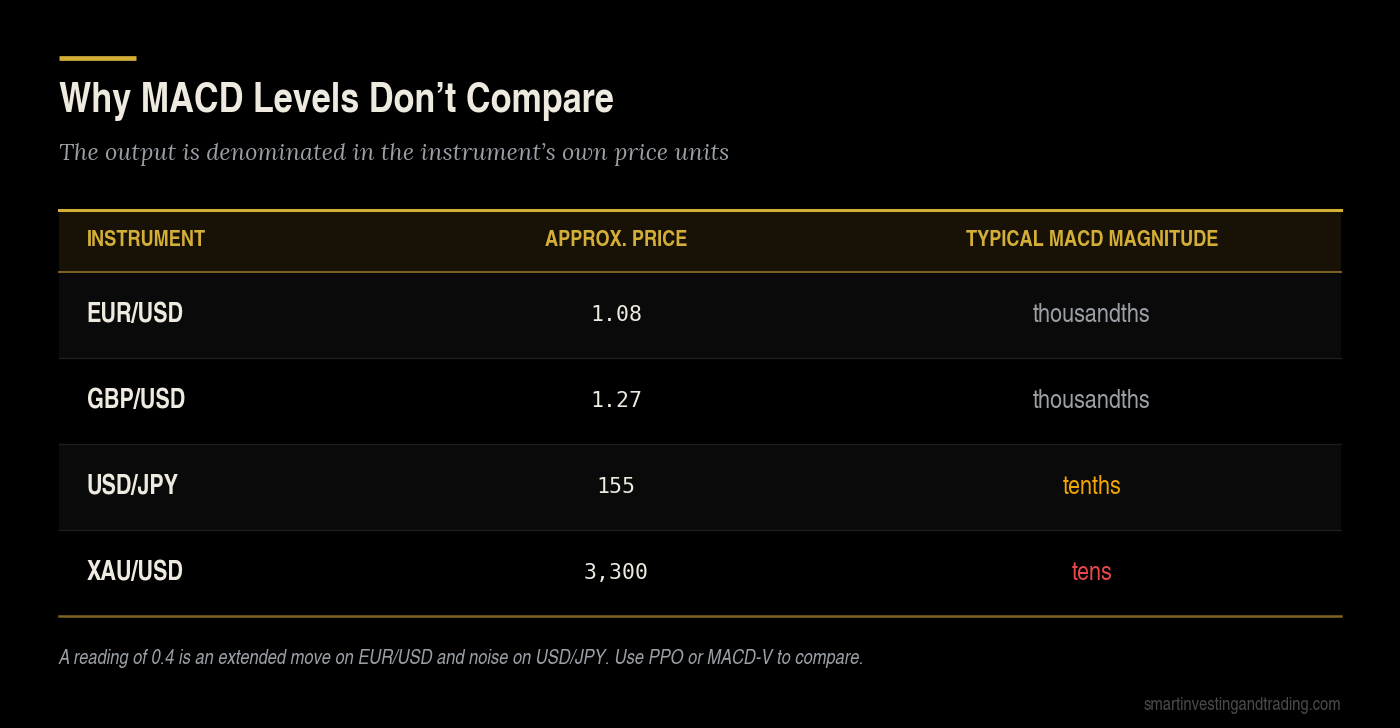
A MACD reading of 0.4 is a strong extended move on EUR/USD and statistical noise on USD/JPY. There is no threshold, no overbought level, no “MACD above X means strong trend” that survives being moved from one pair to another. The same problem applies across time on a single instrument: a MACD level that marked an extreme on EUR/USD at 1.60 in 2008 is a different animal at 1.05.
This is why every honest treatment of MACD talks about crossovers and slopes rather than levels. It’s also why comparing MACD readings across your watchlist to find the “strongest” pair is meaningless unless you normalise first.
Two fixes
The simple one: the Percentage Price Oscillator. PPO is MACD divided by the slow EMA and multiplied by 100 — the same construction expressed in percentage terms rather than price terms. Every crossover is identical, but the values become comparable across instruments and across eras. If you screen a watchlist on momentum, use PPO rather than MACD. It costs you nothing and fixes the scale problem outright.
The thorough one: MACD-V. Alex Spiroglou built the MACD-V to solve the twin problems of bounded oscillators like RSI and Stochastics, which peg at their extremes during strong moves, and unbounded ones like MACD and ROC, which have no fixed extremes at all. He developed it in 2015 and published it in 2022, and the paper won both the NAAIM Founders Award and the CMT Association’s Charles H. Dow Award.</cite>
The construction divides the MACD spread by the 26-period Average True Range and scales by 100: MACD-V = [(12 EMA − 26 EMA) / ATR(26)] × 100, with a 9-period EMA of that as the signal line.
Dividing by ATR rather than by price is the key move. It expresses momentum in units of the instrument’s own volatility, which means a reading of +80 describes the same kind of move on USD/JPY, EUR/USD and gold alike — and the same kind of move in a quiet year as in a violent one. For anyone trading a basket of currency pairs with different volatility profiles, that is the difference between a comparable signal and a meaningless one. Spiroglou’s paper defines specific ranges and lifecycle stages on the normalised scale; it is worth reading in the original rather than in summary.
Your MACD is not the same as your broker’s neighbour’s
Two mechanical points that matter more in FX than anywhere else, because currencies trade around the clock and there is no exchange to define a close.
The daily close is a broker convention. A 26-period EMA of daily closes depends entirely on when the broker ends the day. A broker on New York 5pm and a broker on GMT midnight produce different daily bars, different EMAs, and a MACD that crosses on different days. Add the brokers that print a short Sunday bar — giving six daily bars a week instead of five — and the 26-period window covers a different span of calendar time altogether.
EMA seeding differs by platform. An exponential average has no defined starting point, so platforms seed it differently: some with a simple average of the first n bars, some with the first close, some with a long burn-in period discarded from the chart. On a 26-period EMA of an EMA of an EMA, those choices take a while to wash out. If your backtest and your chart disagree on the first few months of data, this is usually why. Feed enough warm-up bars before the period you care about and the discrepancy disappears.
Neither of these makes MACD unusable. They make it unwise to build a system around a single crossover bar, and unwise to trust a signal that only exists on one data feed.
MACD Forex How to use it without lying to yourself
A short, defensible framework:
- Use the zero line as a regime filter, not a signal. Long setups only while MACD is above zero, short setups only below. This is just a 12/26 EMA filter, which is fine — it’s a reasonable filter.
- Use histogram slope as a timing input. Three consecutive shrinking bars means a cross is coming. Act on the approach, not the arrival.
- Use PPO or MACD-V when comparing instruments. Never rank a watchlist on raw MACD values.
- Treat divergence as a risk instruction. Reduce, tighten, stop adding. Not enter.
- Confirm with something genuinely uncorrelated. MACD, EMAs, and a moving-average-based trend line are three views of the same calculation. Confirming one with another produces confidence without information. Volume, volatility, or structure — see our notes on price action basics — give you something the MACD does not already contain.
- Size the position before the signal. No indicator setting substitutes for position sizing and risk management.
MACD Forex Frequently asked questions
What is the MACD formula? MACD line = 12-period EMA − 26-period EMA. Signal line = 9-period EMA of the MACD line. Histogram = MACD line − signal line. The first subtraction is fast minus slow; reversing it inverts every signal.
Is MACD a leading or lagging indicator? Lagging. It is built from exponential moving averages of past closes, and it confirms moves that have already begun. The histogram is sometimes called leading because it turns before the signal-line cross, but it leads the cross, not the price.
What are the best MACD settings for forex? There is no single answer, and the question is usually the wrong one. 12-26-9 on the daily and 4-hour is a reasonable default. More useful than optimising the numbers is separating entry sensitivity from exit sensitivity, which is what Appel himself recommended.
Why do MACD values differ so much between currency pairs? Because MACD is measured in the instrument’s price units. USD/JPY trades near 155 and EUR/USD near 1.08, so their MACD readings differ by two orders of magnitude for identical moves. Use PPO or MACD-V if you need comparable values.
Who invented the MACD? Gerald Appel, in the late 1970s. The histogram was added separately by Thomas Aspray in 1986.
Does a MACD crossover mean buy? No. A signal-line crossover means the spread between two moving averages has crossed its own nine-period smoothing. In a ranging market that happens constantly and most of those crossings are noise. The zero-line filter exists precisely to discard the ones occurring against the prevailing regime.
Is MACD divergence reliable? Not on its own. It is a fourth-derivative comparison, it fires repeatedly during strong trends, and each early instance is a losing counter-trend trade. Useful as a risk signal, poor as an entry signal.
MACD Forex The short version
MACD measures one thing: the distance between a fast and a slow moving average, and how that distance is changing. It does not measure momentum in any direct sense. It does not predict reversals, and its raw values mean nothing outside the instrument that produced them.
Used as a regime filter with the histogram’s slope for timing and a normalised variant for cross-market comparison. It earns its place on the chart after fifty years. Used as a crossover system on a five-minute chart, it is an efficient method of paying spread.
MACD Forex
Trading foreign exchange on margin carries a high level of risk and is not suitable for all investors. Nothing in this article constitutes investment advice.


Add comment