

MACD – Moving Average Convergence Divergence
Trade Analysis
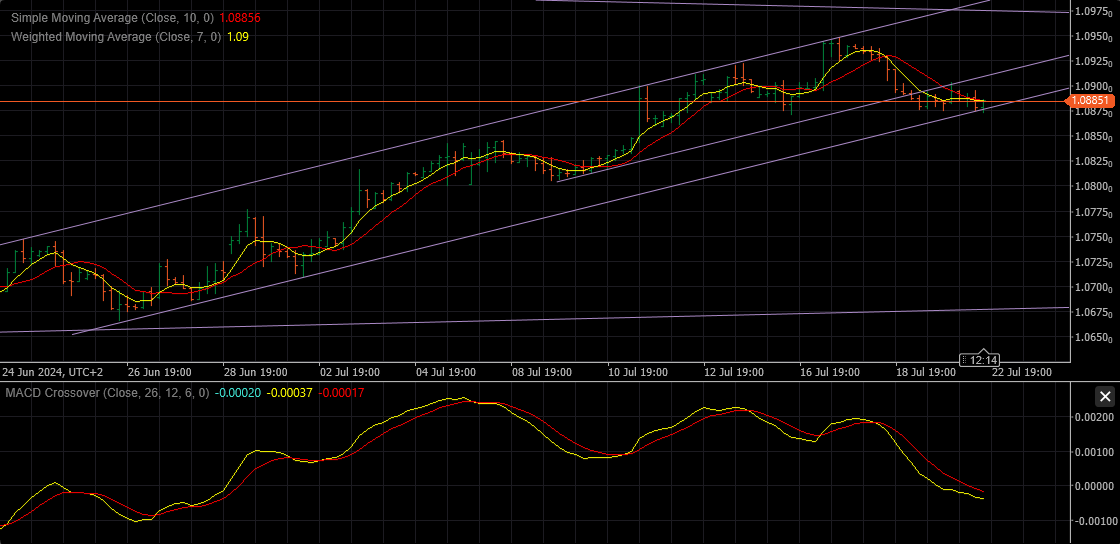
One of pretty useful Technical Indicators is MACD . When properly set up, it does give you a clean view of the waves that are unfolding .
Long cycle : 26
Short cycle : 12
Signal periods : 6
Trade Analysis
As you can see from the chart above, it follows precisely the waves in which market tends to move.
Actually there is a little difference between this MACD and the moving averages that I use.
Trade Analysis – The rules are following :
– Entry is represented by Cross Over of the two lines ( red and yellow here )
– MACD does not have limits up or down – so it doesn’t matter the value that you can see on the right side of it
– If used in a combination with Trend lines, it is not that difficult to place your stop or profit target
– You can constantly be in the position – just following it up or down – BUT – that wouldn’t be smart money wise – to be able to profit maximally out of it, you have to pre set Profit target
– To be able to Pre set Stop Loss you need some homework to be done – using past performance , you have to figure out what are the average pull backs from the open ( when lines cross over ) – that way you will prevent bigger losses , but you can count on few Stops in cases when you would be in the profit if your stop wasn’t hit. So you have to use a common sense and some math to come up with strategy that suits you the best.
Drawbacks
Of course there are some drawbacks with it , like situations when MACD crosses over for just one bar, just to go back in previous direction – not that often, but does happen – so if you enter the position you will lose that one.
Again, you have to do your homework with due diligence and figure out how many times it happens and how many times you will be profitable
That way you will be able to come up with the correct Probability of this little system.
As long as you apply good R/R and Money management ( yes I know, I am obnoxious with it, but until you gonna wake up in the middle of the night thinking first about it, I won’t stop mentioning it) you will be making profit.
Using it in the real time trades, you will get a feeling for it soon enough, and by implementing Trend lines you will never be surprised by its moves.
Strategy
My Strategy would be to follow the Trend on any given time frame ( do not mix time frames when it comes to using macd ) , and like we had the very nice Channel from 26.06 with clear Up trend, I would be only waiting for Buy Signals. I know it looks on this chart that you could drive it both ways, but it is not always this easy – go back in past as much as you have time to do it and you’ll find situations when Trend Following would save you from lots of trouble
Check it out for yourself , and do tell me : how many times it screwed you …
This is a very simple way to trade and Main secret in this sauce is ( once again J Money Management – if you Risk not more than 2% of your margin, you’ll be well of.
Trade Analysis
Add comment