

The Stochastic Oscillator Explained: Settings, Signals and the Traps
Stochastic Oscillator Explained
There is a specific moment that turns a new trader against the stochastic oscillator forever. The indicator crosses above 80. They short. Price rises for six weeks while the oscillator sits pinned in the eighties, crossing down and back up, generating four more sell signals, every one of them wrong.
The conclusion they draw — “stochastics don’t work” — is the wrong conclusion. What actually happened is that they read a range-position reading as a trend-exhaustion reading. Those are different measurements, and the stochastic only ever produces the first one.
This is the first child article branching off the oscillators pillar. Here we take the stochastic apart properly: what the formula actually computes, why fast, slow and full exist and which one you should be running, how the same reading means opposite things in trending versus ranging conditions, and the specific structural failures that generate false signals.
What the stochastic actually measures
George Lane popularised the stochastic oscillator at Investment Educators in the late 1950s, though the underlying work is generally credited to the firm’s founder, Ralph Dystant. Lane spent the rest of his career correcting people about what it does, largely without success.
The stochastic answers one question and one question only:
Where is the current close sitting inside the recent trading range?
Not how strong the trend is. Never whether the move is overextended. Not whether a reversal is due. Just position within range.
The formula makes this obvious:
%K = 100 × (Close − Lowest Low over N periods) / (Highest High over N periods − Lowest Low over N periods)A reading of 100 means the bar closed at the very top of its N-period range. And reading of 0 means it closed at the very bottom. A reading of 50 means it closed in the middle. That is the entire content of the number.
Now consider what a healthy uptrend looks like: price makes higher highs and closes near the top of its recent range, session after session. That produces stochastic readings in the 80s and 90s for as long as the trend persists. The high reading is not a warning. It is the mathematical signature of a functioning trend. Selling it is selling strength because your indicator correctly told you the market is strong.
%D is not a second indicator. It is a 3-period simple moving average of %K — a smoothing line. Anyone treating %K and %D as two independent sources of confirmation is confirming a number against a lagged version of itself.
Stochastic Oscillator Explained
Fast, slow and full — and why the default matters
Three variants exist because raw %K is unusably noisy on most instruments. Each variant applies a different amount of smoothing.
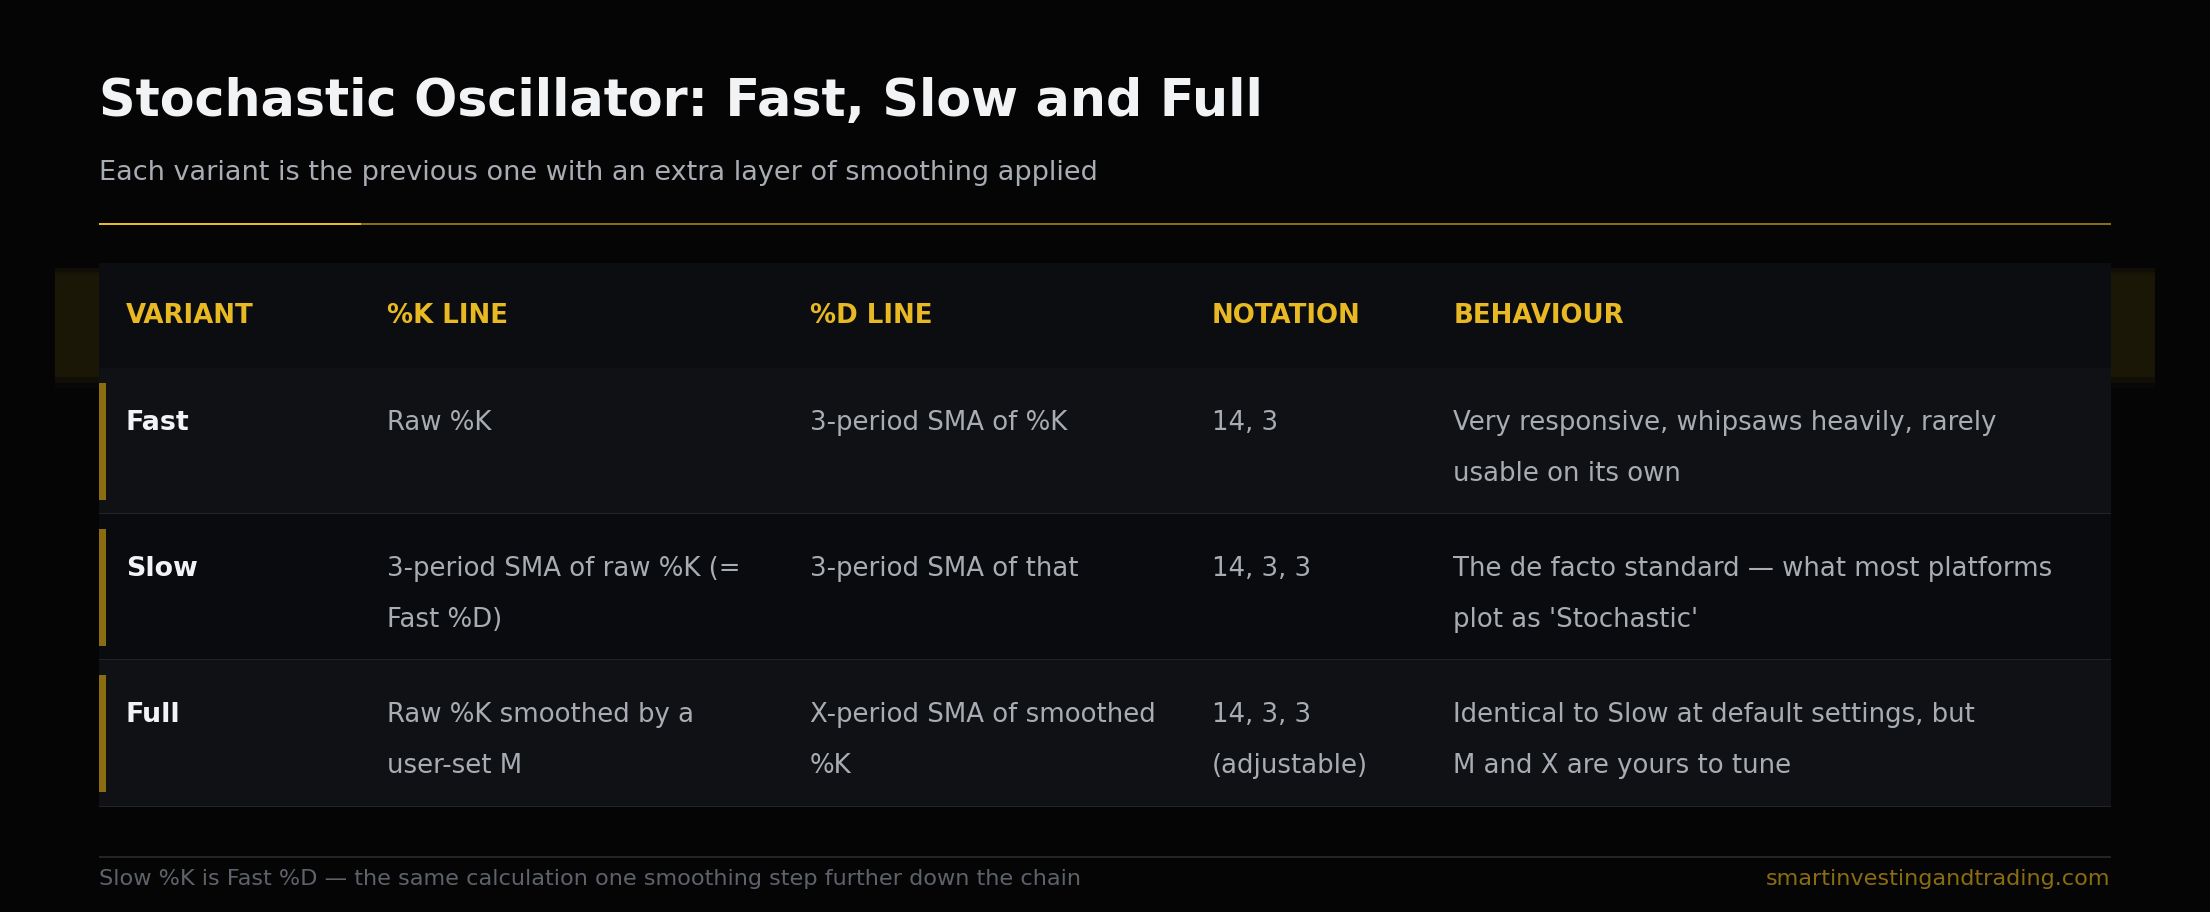
The critical point: Slow Stochastic %K is Fast Stochastic %D. The Slow variant is the Fast variant shifted one smoothing step down the chain. If your platform’s default “Stochastic (14,3,3)” looks different from a colleague’s “Stochastic (14,3)”, this is why — not because one of you has a broken chart.
Full Stochastic is the one worth learning, because it gives you both smoothing parameters explicitly. Once you understand that M controls responsiveness and X controls signal lag, you stop guessing at settings and start choosing them.
Settings by application
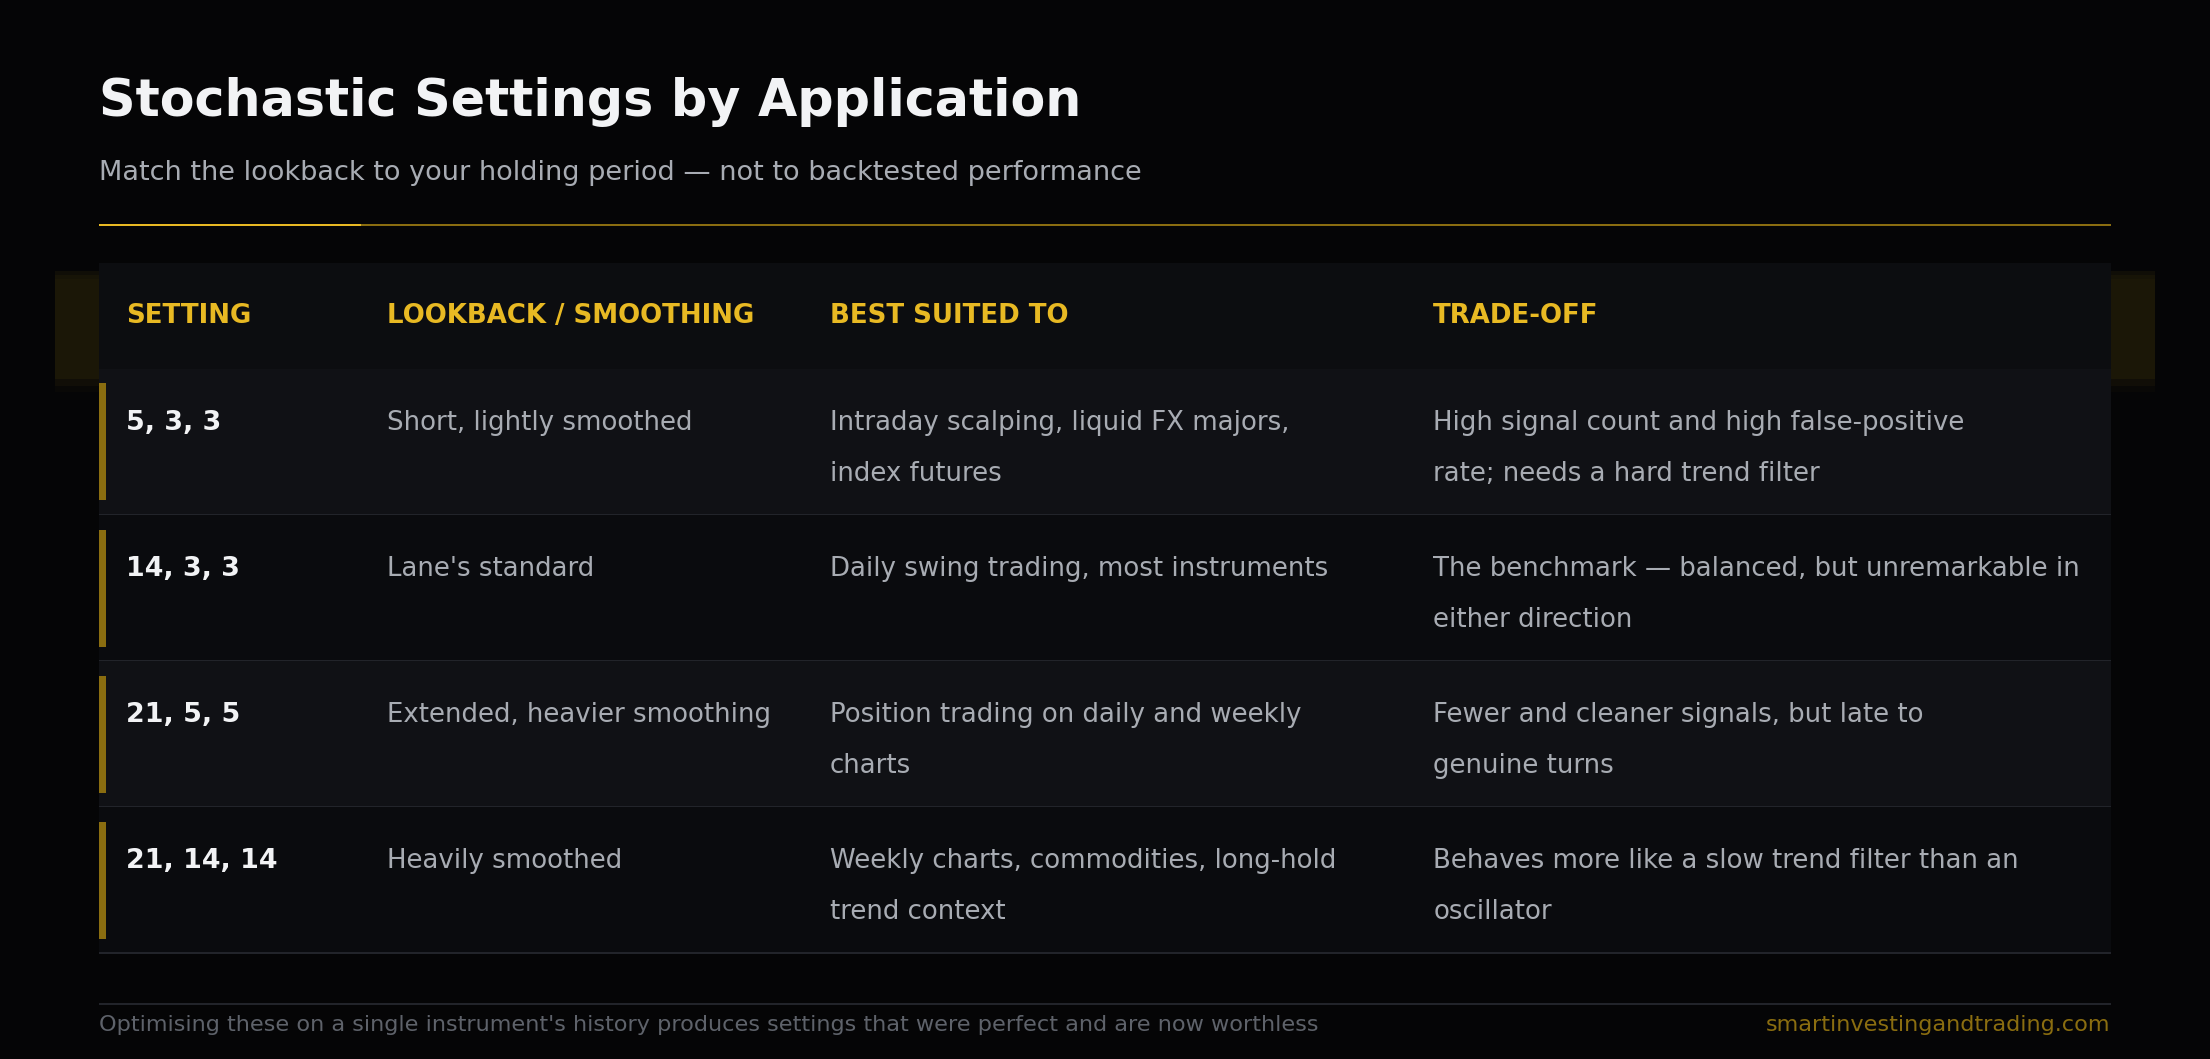
Do not optimise these against historical data on a single instrument. You will find a setting that would have been perfect for the last two years and is worthless going forward. Choose the lookback to match your holding period — that is the only defensible basis.
Reading it correctly: regime comes first
Every valid stochastic signal is conditional on the regime. Establish regime before you look at the oscillator, not after.
In a ranging market
This is where the textbook reading applies. Price is oscillating between defined boundaries, and the stochastic tracks position within that range faithfully.
- Readings above 80 mean price is at the top of the range. In a confirmed range, that is where sellers have historically appeared.
- Readings below 20 mean price is at the bottom, where buyers have historically appeared.
- A
%Kcross back down through 80, or up through 20, marks the point where the edge of the range stopped holding price.
The signal is the exit from the extreme zone, not the entry into it. Entering the zone tells you price reached the boundary. Leaving it tells you the boundary rejected price. Those are separated by an unknown amount of time, and trading the first one is how traders end up short into a breakout.
Stochastic Oscillator Explained – In a trending market
The overbought and oversold levels invert their meaning entirely.
In a sustained uptrend, the stochastic will embed — it parks above 80 and stays there. Lane’s own guidance was that an embedded reading above 80 that persists for several sessions is evidence of trend strength, and that the correct response is to wait for it to leave the zone and stay out before entertaining a short.
More usefully, the pullback level shifts:
- In an uptrend, dips into the 40–50 zone are the buyable pullback. Waiting for 20 in a strong trend means waiting for a level that may never print.
- In a downtrend, rallies into the 50–60 zone are the sellable bounce. Waiting for 80 means missing the whole leg.
This mirrors the way RSI behaves in trend, where the 40–60 band functions as a directional filter rather than a neutral zone — covered properly in the RSI child article.
Crossovers
%K crossing %D is the most-traded and least-reliable stochastic signal in isolation. It fires constantly. On a 14,3,3 daily chart you will get dozens per year per instrument, and the raw hit rate is close to a coin flip.
Crossovers become useful under two conditions only:
- They occur inside an extreme zone (below 20 or above 80), in a market you have already confirmed as ranging.
- They align with the established trend direction — bullish crosses in an uptrend, bearish crosses in a downtrend — as pullback entries rather than reversal calls.
A bearish cross at 85 in a strong uptrend is not a signal. It is noise with good marketing.
Divergence: a warning, not a trigger
Lane considered divergence between %D and price the most important thing the indicator produces. He was right, and the point still gets mangled.
Regular bearish divergence: price makes a higher high, the stochastic makes a lower high. The new price high was achieved with the close sitting lower in its range than last time. Momentum behind the advance is thinning.
Regular bullish divergence: price makes a lower low, the stochastic makes a higher low. Selling pressure is not producing the same range penetration it was.
Hidden divergence runs the other way and is a continuation signal, not a reversal one:
- Hidden bullish: price makes a higher low, the stochastic makes a lower low. Common in healthy uptrend pullbacks — the oscillator resets deeper than price does, and the trend resumes.
- Hidden bearish: price makes a lower high, the stochastic makes a higher high. The mirror case in downtrends.
Hidden divergence is barely covered anywhere and it is the more tradeable of the two, because it puts you with the trend rather than against it.
The discipline: divergence tells you a move is losing fuel. It does not tell you the move is over. Strong trends produce three, four, five consecutive divergences before turning, and each of the early ones bankrupts someone who treated it as an entry. Divergence is a reason to tighten stops, reduce size, or start looking for a structural trigger. It is not itself the trigger.
The trigger is a defined event: a break of the swing low that formed the divergence, a close through a trendline, a failure at a tested level. Something with a price reference and therefore an invalidation point. “Wait a couple of candles” is not a trigger — it is a delay with no defined risk.
Stochastic Oscillator Explained
Where the stochastic breaks
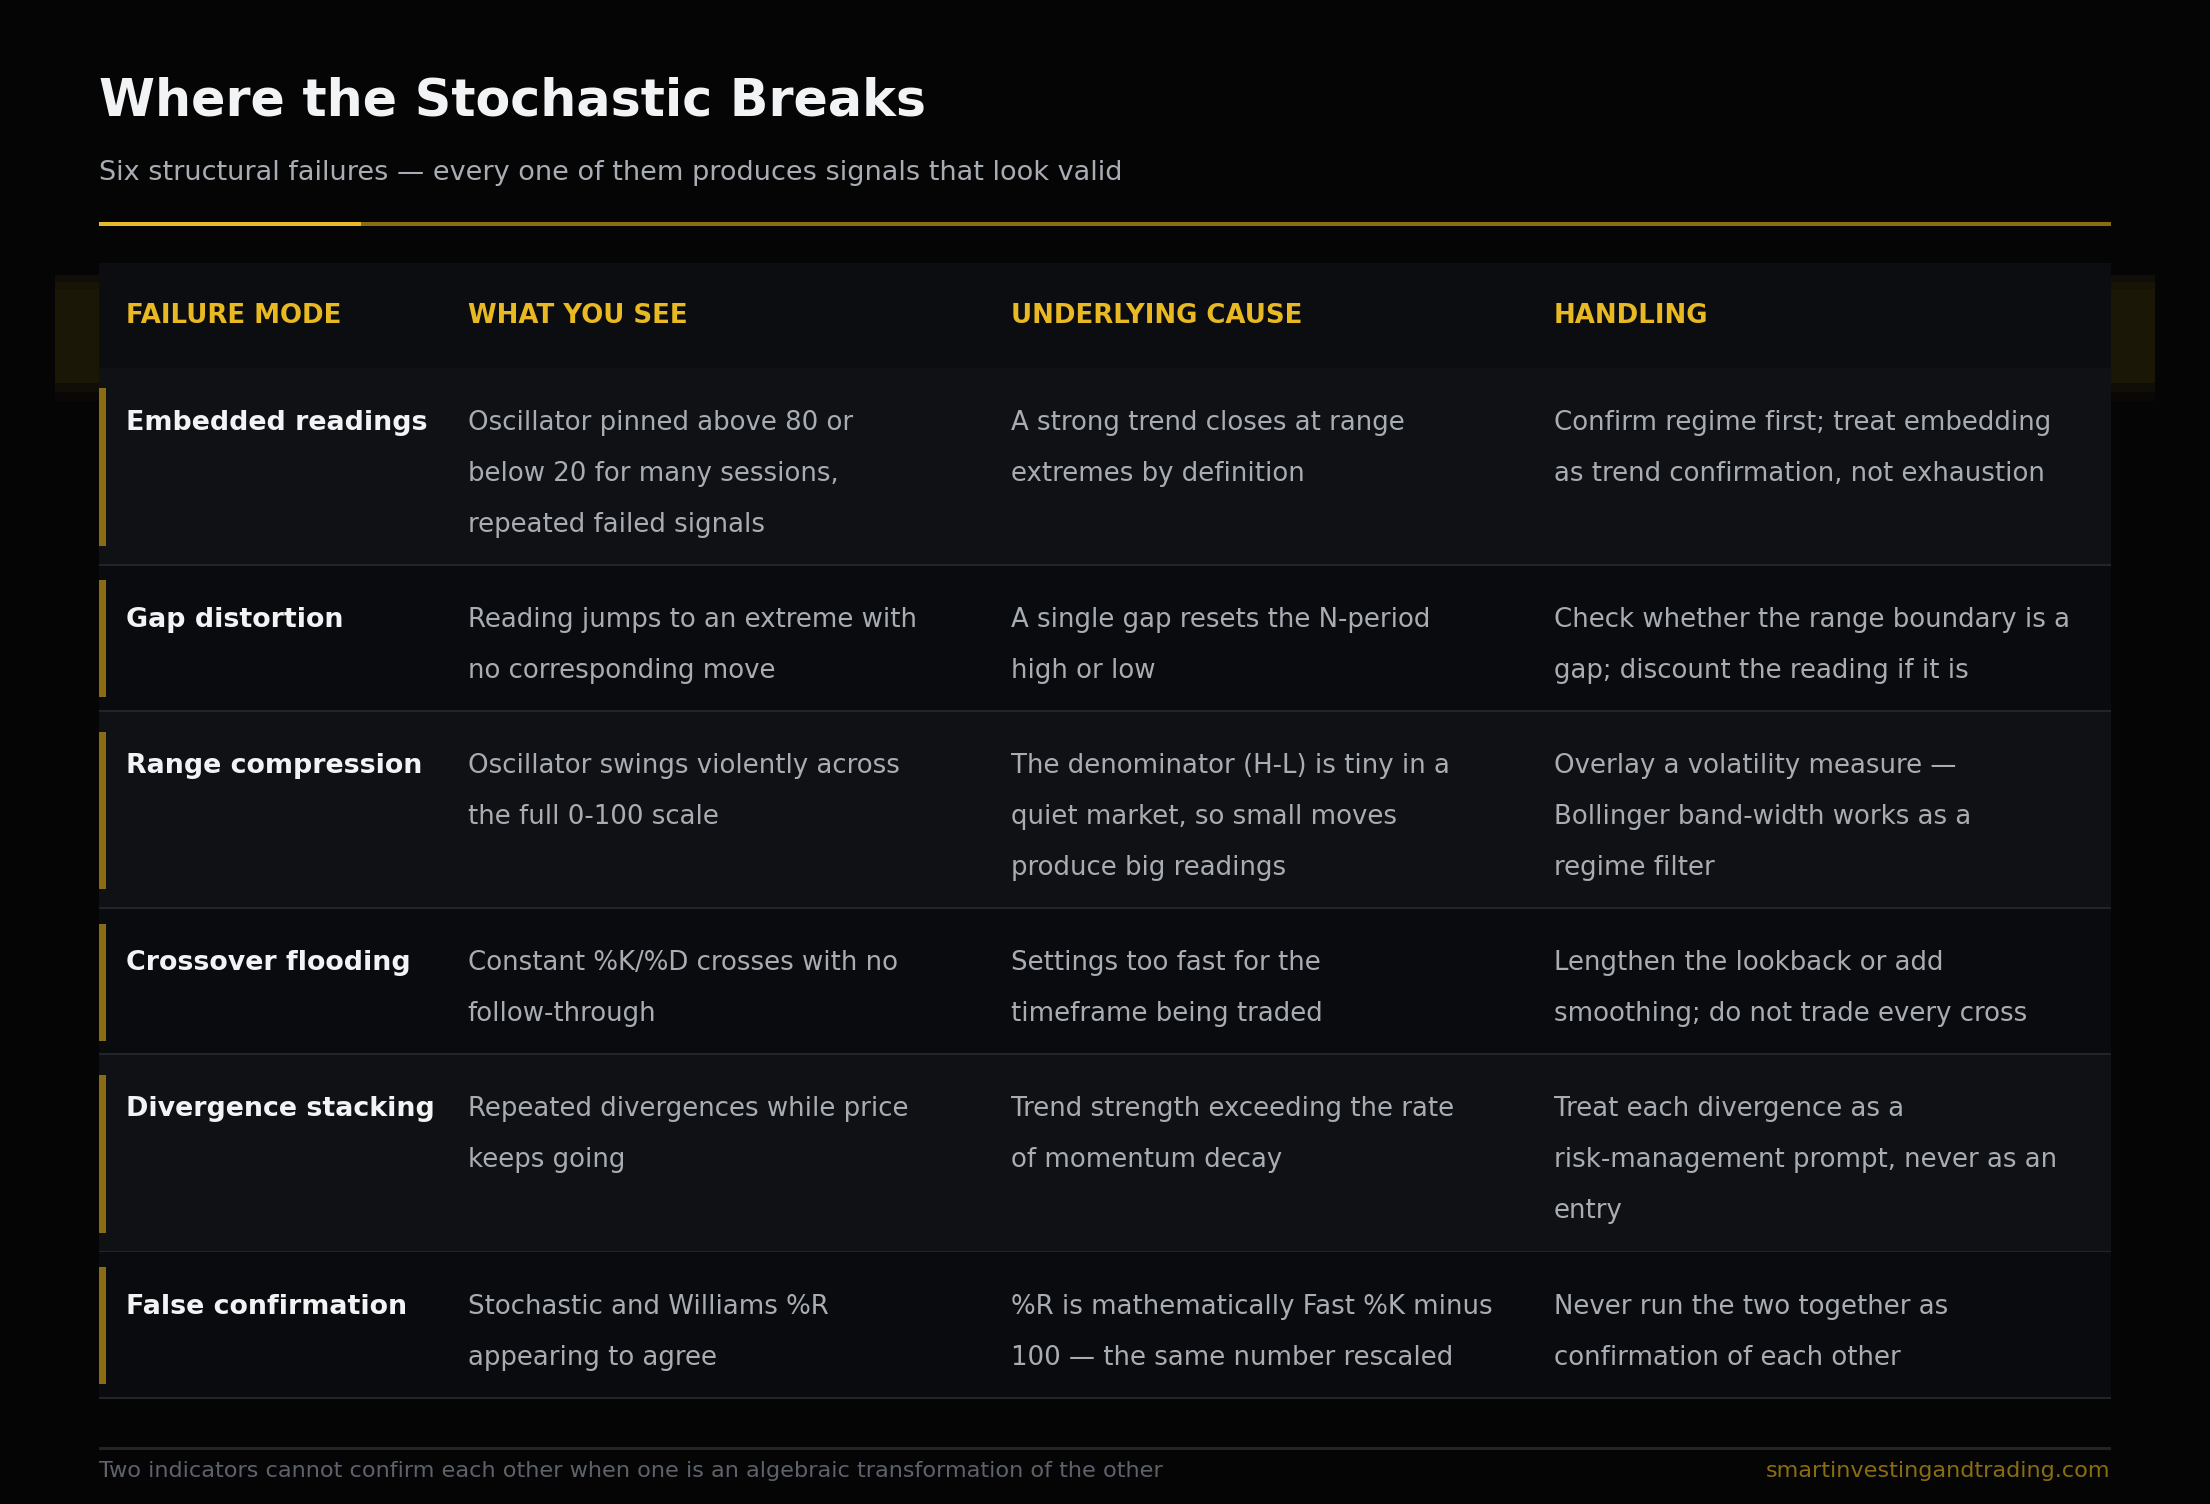
That last row deserves emphasis. Williams %R and Fast %K are the same calculation on a different scale. Two indicators agreeing when one is an algebraic transformation of the other is not confirmation. It is the same number wearing a different hat.
Putting it on a chart properly
The stochastic is a position-within-range tool. It needs pairing with tools that measure things it cannot see.
- Trend context — a moving average, or MACD from the first pillar cluster, establishes direction so you know which reading of the oscillator applies.
- Volatility context — Bollinger Band width tells you whether the range compression that distorts stochastic readings is present.
- Structure — Fibonacci retracement levels give the stochastic’s pullback readings a price reference. A stochastic dip to 45 landing on a 61.8% retracement in an uptrend is a considerably better prospect than a stochastic dip to 45 in open space.
- A different momentum measure — RSI or CCI, which calculate differently and can genuinely disagree with the stochastic. That disagreement carries information. Williams %R cannot disagree with it, which is precisely why it adds nothing alongside it.
A workable sequence: identify regime → establish direction → wait for the stochastic to reach the pullback zone appropriate to that regime → require a structural trigger with a defined invalidation → size the position against that invalidation level.
Notice that the oscillator appears at step three of five. It is a timing tool inside a framework, not the framework itself.
Further reading
- Stochastic Oscillator — StockCharts ChartSchool
- Stochastic Oscillator definition — Investopedia
- Lane’s Stochastics — Technical Analysis of Stocks & Commodities archive
Next in this cluster: the RSI article covers Wilder’s failure swings and why the Cardwell 40–60 zone matters more than the 70/30 levels everyone quotes.
Stochastic Oscillator Explained


Add comment