

Oscillators Indicators: Stochastics, RSI, CCI and Williams %R
Oscillators Indicators
Most traders meet oscillators the same way. Someone shows them a chart, points at the indicator pinned above 80, and says “overbought — it’s going to fall.” They short it. It doesn’t fall. It goes up for another three weeks while the oscillator sits at 95 and does nothing but taunt them.
That experience teaches the wrong lesson. The trader concludes oscillators don’t work. What actually happened is that they used a range-measuring tool in a trending market, which is like using a spirit level to measure the speed of a car.
This guide covers the four oscillators that matter — Stochastics, RSI, CCI and Williams %R — what each one actually calculates, where each earns its keep, and the specific conditions under which each one will lie to you. If you have already read the Bollinger Bands, MACD and Fibonacci pillar, this is the companion piece. Those tools tell you about volatility, trend and structure. These tell you about momentum and position within a range. They answer different questions and they belong on the same chart for exactly that reason.
Oscillators Indicators
What an oscillator actually is
An oscillator measures the rate of price change rather than the direction of price. That distinction is the whole ballgame.
A moving average is a trend-following tool. It lags price by design and it will keep you in a move. An oscillator is a momentum tool. It leads price — sometimes — and it is trying to tell you whether the current move is being driven with the same force it had a week ago.
Two properties define the family:
Bounded vs. unbounded. Stochastics, RSI and Williams %R are mathematically bounded. They cannot go above or below fixed values no matter what price does. CCI is not bounded; it is scaled so that most readings land inside a band, but it can and does run to +400 in a violent move. Bounded oscillators are easier to read at a glance. Unbounded ones carry more information about the magnitude of a move.
Normalised to a range vs. normalised to an average. Stochastics and Williams %R ask: where is the close sitting inside the high-low range of the last n bars? RSI asks: over the last n bars, how much of the total movement was up versus down? CCI asks: how far is price from its own mean, measured in units of its own average deviation? Three different questions. They will disagree with each other, and when they disagree that is information, not noise.
The mistake that costs the most money
Overbought does not mean sell. Oversold does not mean buy.
An oscillator reading above 80 means the closes have been clustering near the top of the recent range. In a genuine trend, that is exactly what you would expect, and it is a sign of strength — not exhaustion. Some of the most profitable trends of the last thirty years have kept their oscillators pinned in the extreme zone for months at a stretch. Cable in 1992. Gold from late 2018 through 2020. The Japanese bond market for most of a decade.
So the first question is never “what is the oscillator reading?” The first question is “what regime am I in?”
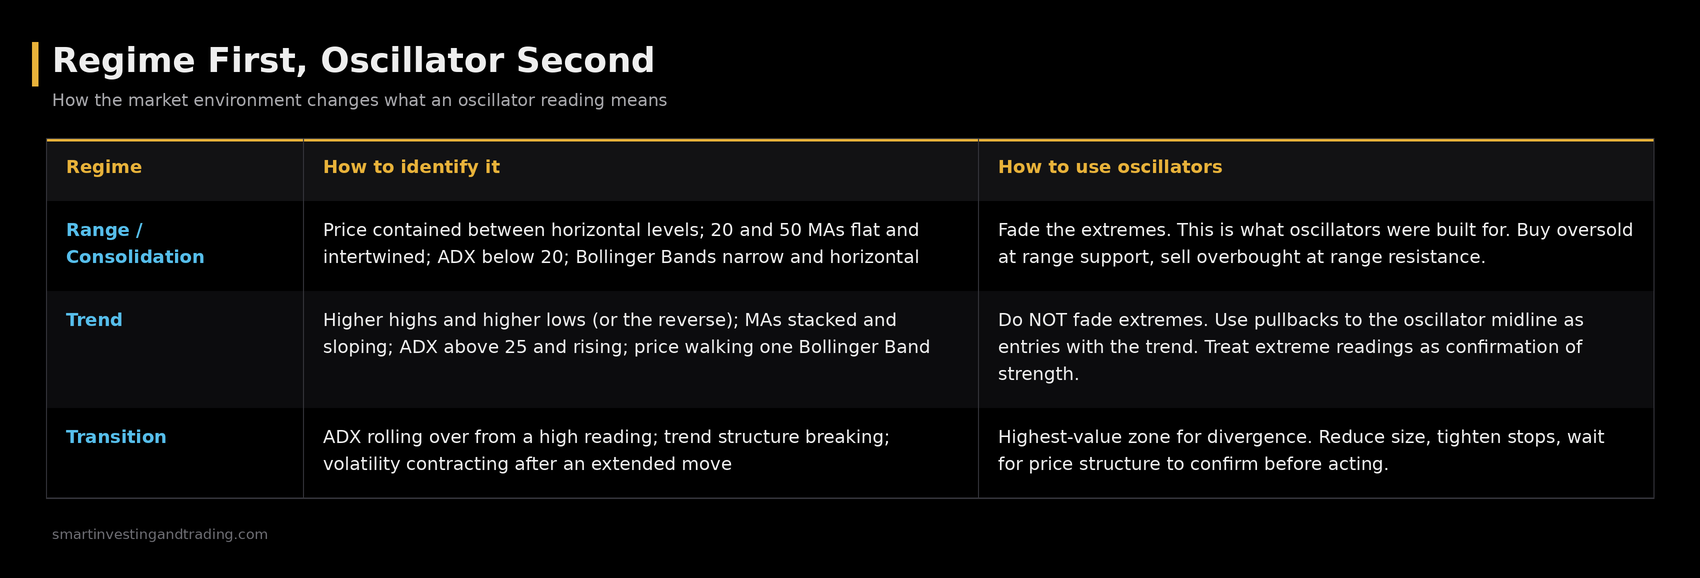
Establish regime first. Read the oscillator second. Reverse that order and you will spend your career selling strength and buying weakness.
Oscillators Indicators
Stochastics
George Lane popularised the Stochastic Oscillator in the 1950s. The premise is simple and still sound: in an uptrend, closes tend to occur near the top of the bar’s range; in a downtrend, near the bottom. The indicator quantifies that tendency.
The calculation
The raw line, %K, is:
%K = 100 × (C − Lₙ) / (Hₙ − Lₙ)Where C is the current close, Lₙ is the lowest low over the lookback period, and Hₙ is the highest high over the same period. The default lookback is 14.
A reading of 100 means today closed at the very top of the 14-bar range. A reading of 0 means it closed at the very bottom.
%D is not a separate indicator. It is a 3-period simple moving average of %K. That is the only reason it turns more slowly — it is the same data, smoothed. Any explanation that presents %D as having independent character has misunderstood the arithmetic.
Fast, slow and full
This trips up more traders than it should, and most tutorials skip it entirely.
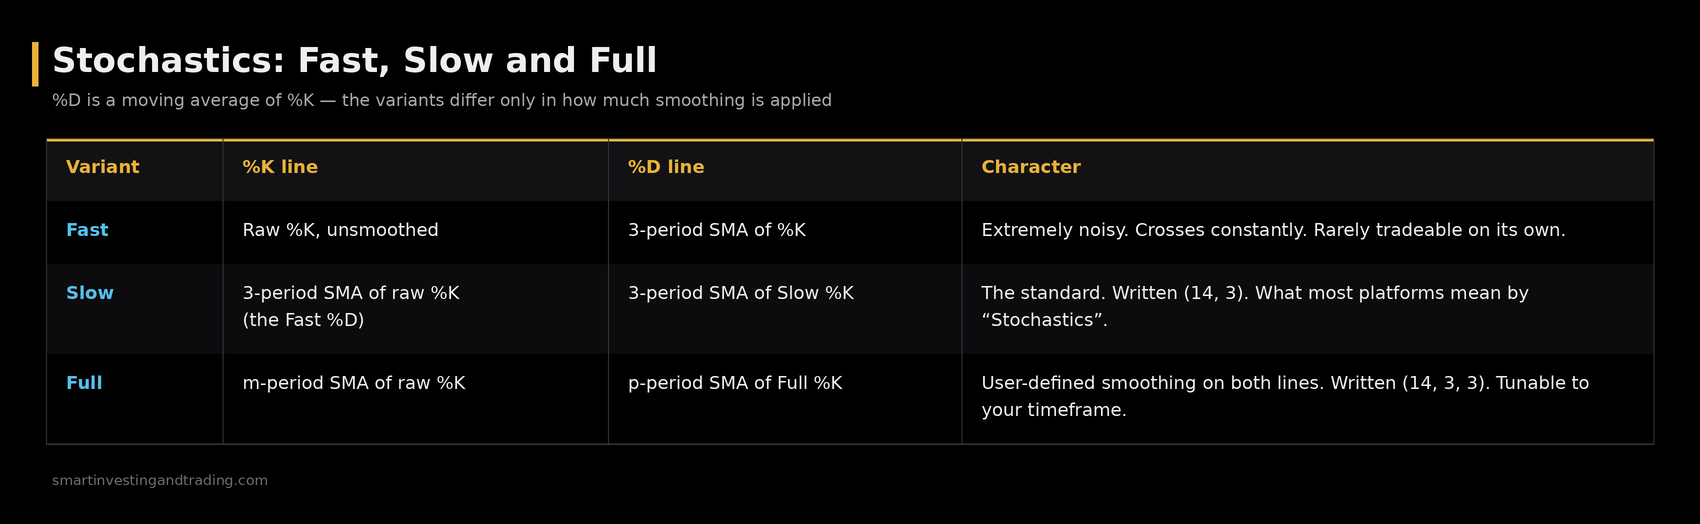
If your Stochastic is whipsawing you to death, there is a good chance you are running Fast Stochastics without realising it. Move to Slow, or to Full with heavier smoothing.
Reading it
Crossovers. %K crossing above %D is a bullish signal; below is bearish. A crossover in the middle of the range is close to meaningless. A crossover occurring below 20 in an established uptrend, at a level where price also has support, is worth acting on. Location is everything. The signal is not the cross — the signal is the cross at a place that matters.
Extremes. In a range, above 80 and below 20 mark the fade zones. In a trend, they mark participation. Same reading, opposite meaning, determined entirely by regime.
The midline. In a strong uptrend, Stochastics will often bottom around 40–50 rather than reaching 20. Those shallow pullbacks are the trend-following entries. Waiting for a “proper” oversold reading in a strong trend means waiting for a train that has already left.
Where it fails
Stochastics degrade badly in two conditions. The first is a tight, low-volatility chop, where the high-low range is so narrow that a one-tick move swings %K thirty points. The second is a powerful directional move, where %K embeds above 90 or below 10 and stays there. Embedding is not a sell signal. Embedding is the market telling you it is serious.
Oscillators Indicators
Relative Strength Index (RSI)
J. Welles Wilder introduced RSI in New Concepts in Technical Trading Systems in 1978, alongside ATR, ADX and Parabolic SAR. It has aged better than almost anything else from that era.
The name causes confusion. RSI does not compare one instrument to another — that is comparative relative strength. Wilder’s RSI compares an instrument to its own recent history.
The calculation
RSI = 100 − [100 / (1 + RS)]

where RS = Average Gain / Average Loss over n periods
Wilder used 14 periods and his own smoothing method, not a simple average. The first value uses a simple average of the first 14 periods; every subsequent value is:
Average Gain = [(previous Average Gain × 13) + current Gain] / 14That smoothing is why RSI values differ slightly between platforms that implement it as an SMA or EMA instead. If you are backtesting, check which your platform uses.
The levels — and where the common version is wrong
Wilder’s levels are 70 and 30. Not 80 and 20.
You will see 80/20 quoted constantly, often in articles that use it for both RSI and Stochastics as though the two indicators share a scale. They do not. 80/20 is a filter — a deliberate widening of the thresholds to cut false signals in strongly trending markets. It is a legitimate adjustment. It is not the default, and presenting it as such tells you the writer copied it from somewhere else without checking.
Failure swings — Wilder’s actual reversal signal
This is the part almost everyone omits, and it is the most useful thing in the original book.
A top failure swing requires four steps:
- RSI pushes above 70.
- RSI pulls back, forming a trough.
- RSI rallies again but fails to exceed its prior peak.
- RSI breaks below the trough formed in step 2.
Step 4 is the signal. Not step 1. A bottom failure swing is the mirror image below 30.
Notice what this structure does: it requires the oscillator to demonstrate loss of momentum and then confirm it by breaking its own structure. It is not a level being touched. It is a pattern completing. That is why it produces far fewer signals and far better ones.
The 40–60 zone
Andrew Cardwell’s work on RSI added a layer Wilder did not cover, and it is genuinely valuable for regime identification:
- In a bull market, RSI tends to oscillate between roughly 40 and 80, with the 40–50 zone acting as support. Pullbacks that hold above 40 confirm the uptrend is intact.
- In a bear market, RSI tends to oscillate between roughly 20 and 60, with the 50–60 zone acting as resistance. Rallies that fail below 60 confirm the downtrend.
When RSI breaks through its established zone — when a bull market’s 40 support gives way — that is a meaningful regime warning, often earlier than price structure will give you one. I have found this more reliable on daily and weekly charts than on intraday, and more reliable in FX and bonds than in individual equities.
Period selection
A 5-period RSI is violently sensitive and will produce dozens of signals, most of them noise. A 21-period RSI is smooth and slow. Wilder’s 14 remains a sensible default.
One clarification the source material for this article muddled badly: the indicator period and the chart timeframe are not the same thing. A 14-period RSI on a 5-minute chart and a 14-period RSI on a weekly chart are the same calculation applied to different data. Changing the period changes sensitivity. Changing the timeframe changes what you are looking at. Decide your timeframe based on your holding period, then adjust the period only if the default is genuinely too noisy or too slow for that instrument.
Oscillators Indicators
Commodity Channel Index (CCI)
Donald Lambert introduced CCI in 1980. Despite the name, it works on anything — currencies, indices, bonds. Lambert was a commodity trader and named it accordingly.
The calculation
Typical Price (TP) = (High + Low + Close) / 3

CCI = (TP − SMA of TP) / (0.015 × Mean Deviation)
The 0.015 constant was chosen so that roughly 70–80% of readings fall between −100 and +100. That is the whole purpose of the constant — it scales the output into a familiar band without capping it.
Default period is 20. Lambert’s own recommendation was to use roughly one-third of the dominant cycle length, which is a more thoughtful approach than accepting a default if you have identified a cycle in the instrument you trade.
What makes it different
CCI is unbounded. That matters more than it sounds.
When Stochastics hits 100, it stops. It cannot tell you whether the move that got it there was strong or extraordinary. CCI at +300 versus CCI at +120 tells you something real about the violence of the move. For traders working in commodities, metals and FX crosses — where breakouts genuinely run — this magnitude information is worth having.
Reading it
The ±100 breakout method. Lambert’s original approach was the opposite of a fade. Buy when CCI crosses above +100; exit when it crosses back below. Sell when it crosses below −100; exit when it crosses back above. This treats extreme readings as breakout confirmation, not exhaustion — which is a far better fit for how markets actually behave than the reflexive fade.
The zero line. Crosses of the zero line are the cleaner trend signal. CCI above zero means typical price is above its mean; below zero, the reverse.
Extreme readings beyond ±200. These do carry genuine exhaustion information, particularly on daily charts, but they still need structural confirmation before you act.
Oscillators Indicators
Williams %R
Larry Williams developed %R in the 1970s. Here is the thing nobody tells beginners:
%R = −100 × (Hₙ − C) / (Hₙ − Lₙ)Compare that to the Stochastic %K formula. Williams %R is Fast %K, inverted and shifted. Specifically:
%R = %K − 100The lines are mathematically identical in shape. %R simply runs on a scale from −100 to 0 instead of 0 to 100, with −20 as the overbought threshold and −80 as oversold.
So why use it? Two honest reasons and one bad one.
The honest reasons: %R is unsmoothed by default, so it responds faster than Slow Stochastics — useful for short-term traders who want the raw signal. And the inverted scale, once you are used to it, makes it visually obvious when price is failing to reach the top of its range.
The bad reason is running %R and Fast Stochastics on the same chart and believing you have two confirming indicators. You have one indicator drawn twice. This is the single most common form of false confirmation in retail technical analysis, and it is worth checking your own chart layout for right now.
If you want genuine confirmation, pair a range-based oscillator (Stochastics or %R) with a change-based one (RSI) or a mean-deviation one (CCI). Different mathematics, genuinely independent information.
Oscillators Indicators Quick comparison
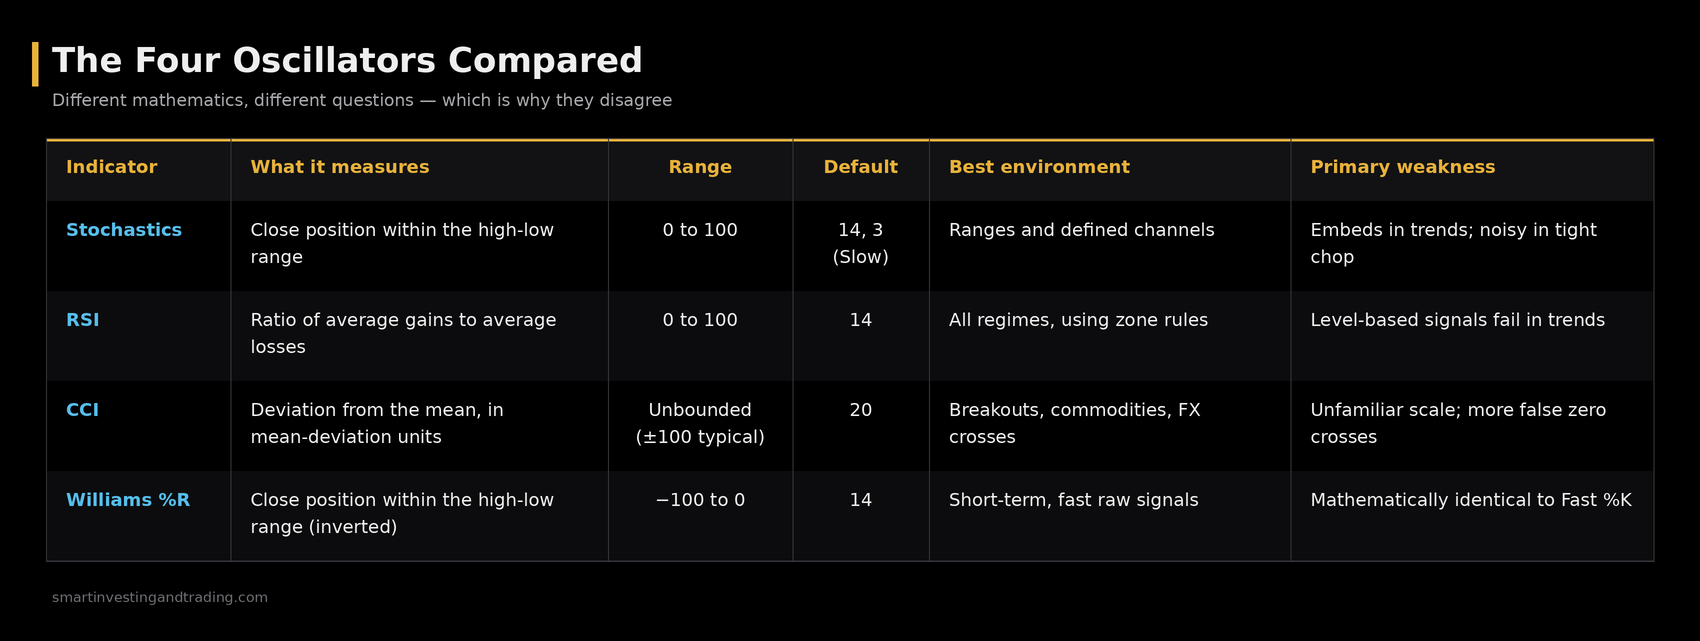
Divergence: the good, the bad and the misunderstood
Divergence is where oscillators earn their reputation, and where most traders lose money using them.
Regular divergence — potential reversal
Bearish: price makes a higher high, the oscillator makes a lower high. Buying pressure is weakening even as price extends.
Bullish: price makes a lower low, the oscillator makes a higher low. Selling pressure is exhausting.
Hidden divergence — trend continuation
This is the one most traders have never heard of, and it is arguably more tradeable.
Hidden bearish: price makes a lower high while the oscillator makes a higher high. In a downtrend, this signals continuation — a rally with no real conviction behind it.
Hidden bullish: price makes a higher low while the oscillator makes a lower low. In an uptrend, this signals continuation — a shakeout that failed to do damage.
Regular divergence trades against the trend. Hidden divergence trades with it. Given that trading with the trend has better base rates, hidden divergence deserves more attention than it gets.
Why divergence fails
Divergence is a condition, not a trigger. A market can display textbook bearish divergence and keep rising for months, printing three more divergences on the way. Each one looked like a signal. Each one was a warning that the market ignored.
The advice you will read — that divergence means book profits and reverse your position — is how accounts get destroyed. Divergence means reduce risk and prepare. It does not mean enter.
What confirmation actually means
You will read that you should “wait one or two sessions for confirmation.” That is arbitrary. Two sessions is not a confirmation, it is a delay.
Confirmation is an event, not a count:
- A break of the swing low that formed during the divergence
- A close through the trendline connecting the divergent highs
- A close back inside a Bollinger Band after walking it
- A break of the RSI zone floor (40 in a bull regime)
- A failure swing completing
Any of those is a definable, testable, repeatable trigger. “Two days” is not.
Oscillators Indicators – Building the full picture
Oscillators are one leg of a three-legged stool. They tell you about momentum and position. They tell you nothing about volatility, and almost nothing about where the structural levels are.
The complete read on a chart looks something like this:
- Regime — trend or range? ADX, moving average structure, Bollinger Band width.
- Structure — where are the levels? Prior highs and lows, Fibonacci retracements, round numbers.
- Volatility — is the market expanding or contracting? Bollinger Bands, ATR.
- Trend momentum — MACD for the underlying directional pressure.
- Position momentum — the oscillators covered here, for timing within that framework.
An oscillator signal that agrees with the structure, the volatility state and the regime is a trade. An oscillator signal in isolation is a coin flip with extra steps.
Oscillators Indicators – Common mistakes, collected
- Fading extremes in a trend. The costliest error in this entire family of tools.
- Running two versions of the same indicator. Fast Stochastics and Williams %R. Or three moving-average-based oscillators. Correlated inputs are not confirmation.
- Using 80/20 on RSI without knowing why. It is a trend filter, not a default.
- Treating divergence as an entry. It is a warning.
- Optimising the period until the backtest looks good. You have curve-fitted, not discovered.
- Ignoring the timeframe above. An oversold 15-minute Stochastic inside a daily downtrend is not a buy signal, it is a pullback in a sell.
- Waiting for perfect readings. In strong trends, they never come. The 40–50 pullback is the entry.
Oscillators Indicators – Where to go from here
Each of these four indicators has enough depth to deserve its own treatment, and each one has quirks that only show up when you trade it seriously across different instruments and timeframes. Detailed guides to Stochastics, RSI, CCI and Williams %R follow from here.
If there is one idea to take away, it is this: an oscillator does not tell you what price will do. It tells you about the character of the move that has already happened. Reading it as a prediction is the mistake. Reading it as a description — and then combining that description with structure, volatility and regime — is how these tools were meant to be used.
Oscillators Indicators Further reading
- Wilder, J. Welles — New Concepts in Technical Trading Systems (1978), the original source for RSI
-
StockCharts ChartSchool: RSI
-
StockCharts ChartSchool: Stochastic Oscillator — Fast, Slow and Full
-
StockCharts ChartSchool: Commodity Channel Index
-
StockCharts ChartSchool: Williams %R


Add comment