

Fibonacci in Forex
The Corrected Guide to Ratios, Levels and What the Evidence Actually Shows
Fibonacci Retracement Forex
Fibonacci retracement is the most-drawn and least-understood tool in retail forex. It appears on every chart in every trading room, it is taught in every beginner course, and almost everything those courses say about it is wrong in at least one of three ways: wrong about where the ratios come from, wrong about who invented them, or wrong about what the evidence says they do.
This article is the third in a series expanding on our pillar guide to Bollinger Bands, MACD and Fibonacci. We have already covered Bollinger Bands and MACD. Fibonacci is the hardest of the three to write honestly about, because unlike the other two it has no formula to get right — it has a set of assumptions to examine.
Let us examine them.
Fibonacci Retracement Forex – Where the ratios actually come from
The Fibonacci sequence begins 0, 1, 1, 2, 3, 5, 8, 13, 21, 34, 55, 89, 144, and continues by adding the previous two terms. Everything used on a chart derives from ratios between terms in that sequence, and those ratios converge as you move further along it.
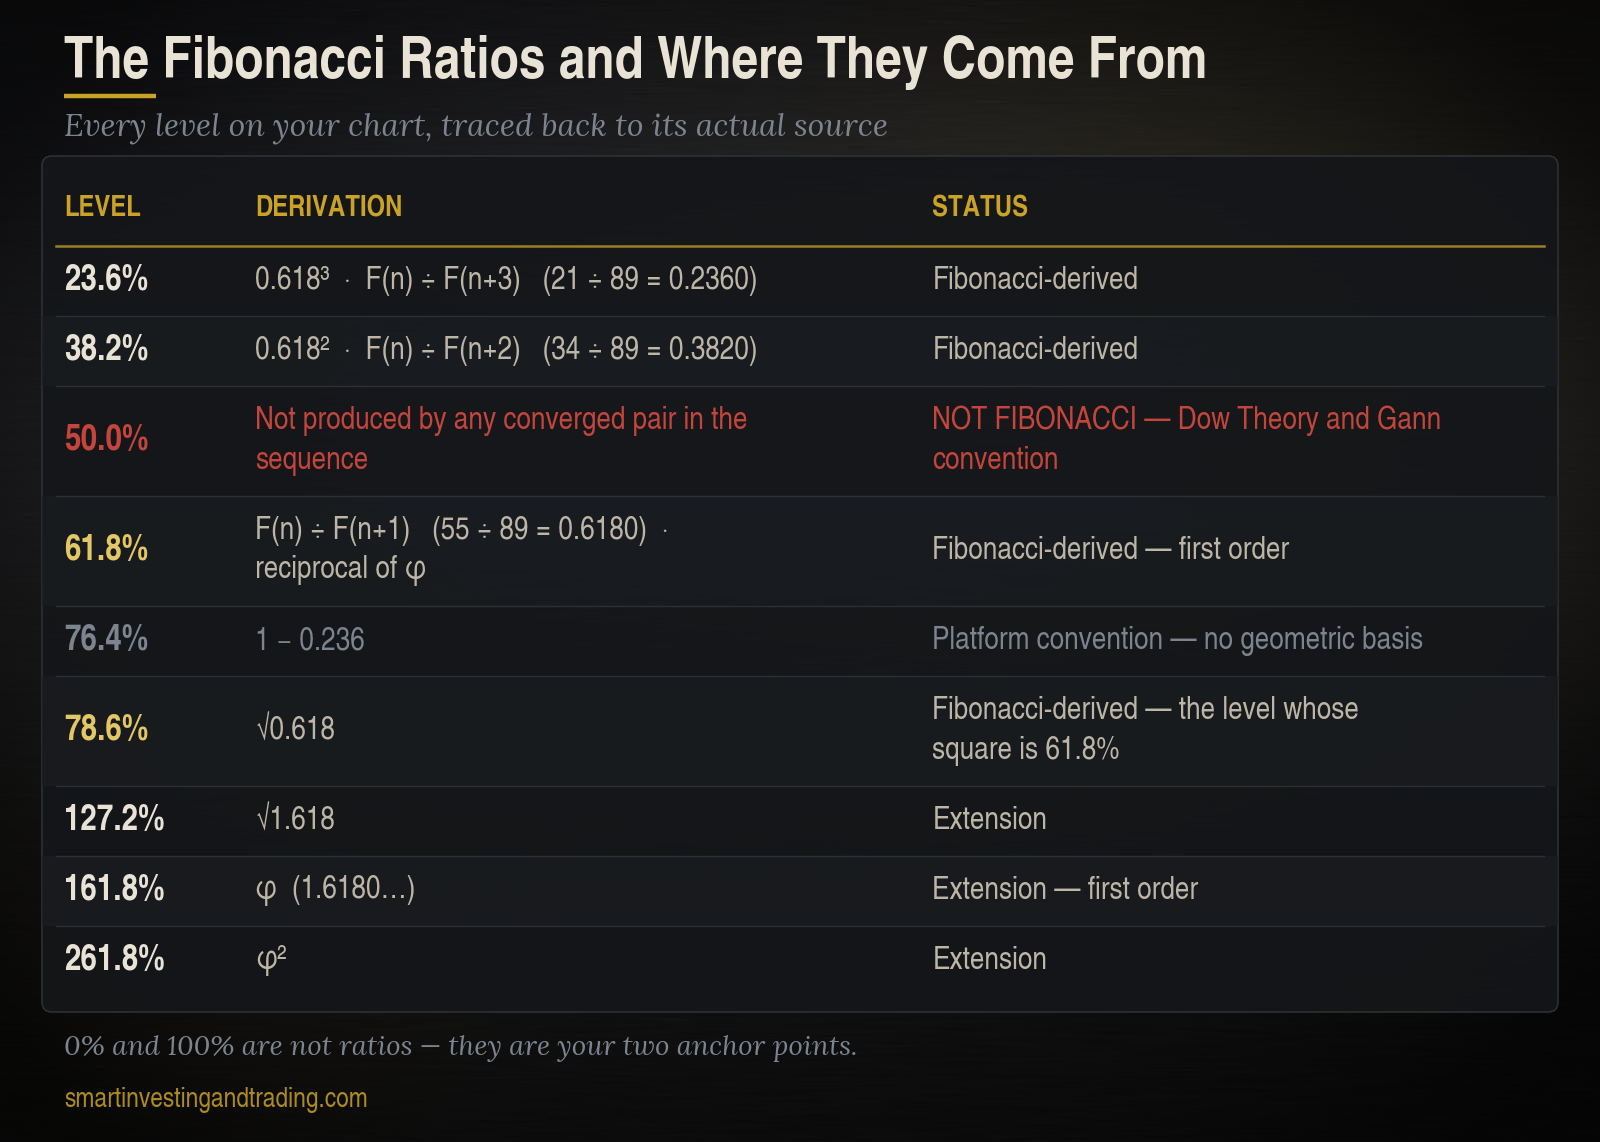
61.8% is the limit of any term divided by the next term. 55/89 = 0.6180. 89/144 = 0.6181. This is the reciprocal of the golden ratio φ (1.6180…), and it is the only retracement level with a direct, first-order derivation.
38.2% is a term divided by the term two places ahead. 34/89 = 0.3820. It is also 0.618 squared, and also 1 − 0.618. Three routes to the same number.
23.6% is a term divided by the term three places ahead. 21/89 = 0.2360. It is 0.618 cubed.
78.6% is the square root of 0.618. This one matters, because a great many platforms draw 76.4% instead, which is simply 1 − 0.236. Both numbers have a lineage; only 78.6% has a geometric one — it is the level whose square is the 61.8% level, which is why harmonic pattern traders use it and nobody else does. If your platform draws 76.4%, that is a convention choice, not a mathematical fact. Know which one you are looking at before you place an order at it.
On the extension side, 127.2% is the square root of 1.618, 161.8% is φ itself, 261.8% is φ squared, and 423.6% is φ cubed.
The 0% and 100% lines are not ratios at all. They are your two anchor points, and as we will see, they are the entire problem.
Fibonacci Retracement Forex
50% is not a Fibonacci ratio
This is the single most repeated error in trading education, and it is worth stating plainly: 50 does not appear in the Fibonacci sequence, and no pair of converged sequence terms produces 0.5.
The pedantic caveat, which is worth knowing so nobody catches you out with it: at the very start of the sequence, before the ratios converge, 1 divided by 2 does equal 0.5. But nobody uses the 50% level for that reason, and no author has ever justified it that way. It is there because of a much older observation.
Charles Dow noted that the averages commonly retrace roughly half of a prior move. W.D. Gann built a system around halves and eighths. The 50% level entered technical analysis through that tradition and was later absorbed into Fibonacci toolsets by sheer convenience — it sits neatly between 38.2% and 61.8%, and platforms drew it because traders wanted it.
Here is the honest part: none of this makes 50% useless. It is arguably the most-watched retracement level in the market, and for reasons we will get to, that is the property that matters. But calling it a Fibonacci level is wrong. And if a course tells you it is one, you should treat everything else that course says with suspicion, because it means the author never checked.
Fibonacci did not discover the sequence, and never applied it to markets
Leonardo of Pisa (c. 1170 – c. 1250) published Liber Abaci in 1202. Thirteenth century, not twelfth, and not fifteenth — both errors are common in trading articles.
He did not discover the sequence. It appears centuries earlier in Indian prosody, in the work of Pingala and later Virahanka, Gopala and Hemachandra, as the count of ways to arrange short and long syllables in a metre of given length. Leonardo introduced it to Europe as a toy problem about breeding rabbits, in a book whose actual importance was introducing Hindu-Arabic numerals to European commerce. That is his real contribution, and it is a far larger one than the sequence.
He never connected the sequence to the golden ratio either. Kepler made that link in the seventeenth century. The name “Fibonacci” was coined in the nineteenth century by the historian Guillaume Libri, roughly six hundred years after the man’s death.
And Leonardo of Pisa certainly never applied any of it to financial markets. That was Ralph Nelson Elliott, who proposed the Fibonacci sequence as the mathematical foundation of his Wave Principle in Nature’s Law (1946), roughly seven centuries later.
So when a course opens with “a 13th-century Italian mathematician discovered a hidden pattern that governs financial markets,” it manages three errors in a single sentence: he did not discover it, he never wrote about markets, and the pattern was not his.
Fibonacci Retracement Forex
The anchoring problem: why every backtest disagrees
This is the section that matters more than all the mathematics above, and it is the one almost nobody teaches.
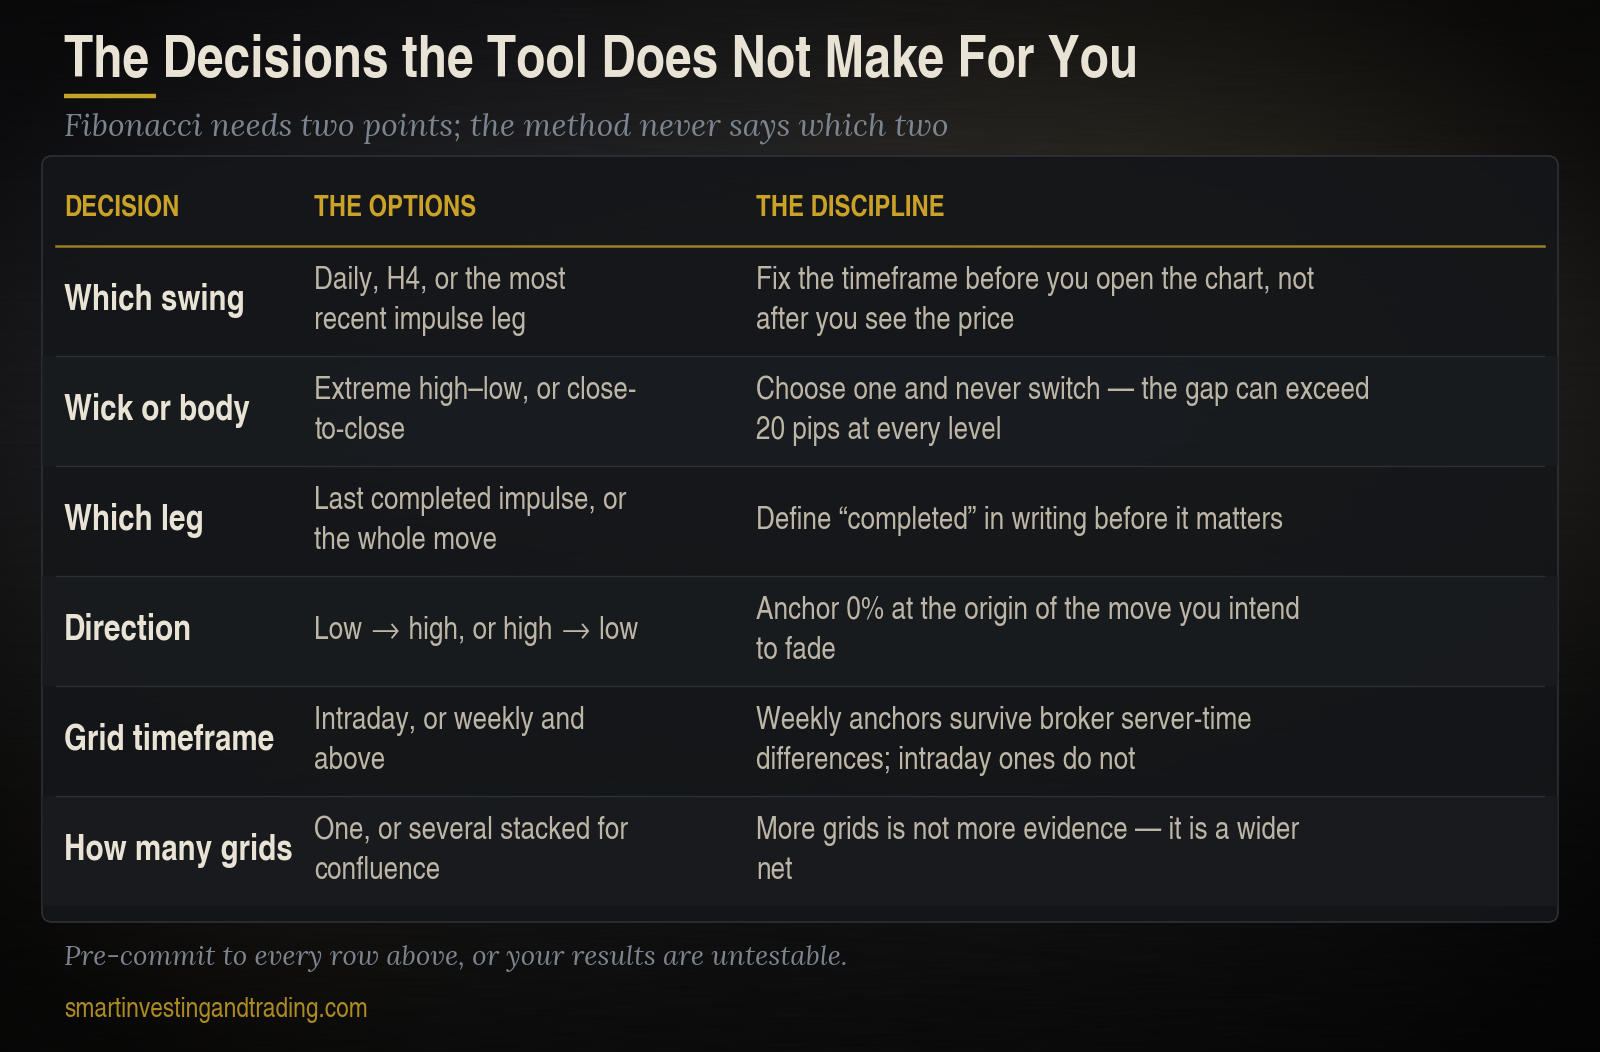
The Fibonacci retracement tool requires two points: a swing high and a swing low.
Nothing in the method tells you which two
Give the same EUR/USD chart to three competent traders and you will get three different grids. One anchors to the daily swing, one to the four-hour, one to the most recent impulse leg. All three sets of levels are legitimate applications of the tool. None of them agrees with the others.
It gets worse at the detail level. Do you anchor to the wick or the candle body? The extreme high or the close? On a pair that spiked forty pips into a news release and reversed, wick-to-wick and body-to-body grids differ by roughly twenty-five pips at every single level — which is the difference between a fill and a miss on every entry the grid generates.
The consequence is that Fibonacci is unfalsifiable in hindsight. Draw enough grids from enough swings on a chart you already know the outcome of, and every meaningful turn will sit on a level from one of them. This is precisely why the tool looks flawless in course material and ambiguous on a live chart. The course author chose the swing after seeing the result. You have to choose it before.
The fix is pre-commitment, and it is not optional. Decide your anchoring rule in writing, before you open the chart: which timeframe supplies the swing, wick or body, and how you define a completed impulse leg. Apply it mechanically. Only then does the tool become something you can actually test, and only then do your results mean anything.
A trader with a mediocre rule applied consistently will outperform a trader with an excellent rule applied whenever the chart looks tempting. This is not really a Fibonacci point. It is a point about discretionary tools generally, and Fibonacci is simply the one where the discretion is most invisible.
Fibonacci Retracement Forex
What the evidence actually shows
There are two serious pieces of research here, and they appear to contradict each other. They do not.
The negative result
Tsinaslanidis, Guijarro and Voukelatos published an algorithmic study of Fibonacci retracements in Expert Systems with Applications (2022), testing across the Dow, NASDAQ and DAX. They built an automated identification scheme specifically to remove the subjectivity problem described above, then compared bounce behaviour at Fibonacci levels against bounce behaviour at randomly selected non-Fibonacci levels. Their finding: prices were no more likely to find support or resistance at Fibonacci levels than at arbitrary ones, and a trading rule built on Fibonacci zones failed to outperform an identical rule built on random zones. They also found that wider zones produced more bounces — which is a polite way of observing that a bigger net catches more fish.
The positive result
Carol Osler, then a senior economist at the Federal Reserve Bank of New York, published Support for Resistance: Technical Analysis and Intraday Exchange Rates in the Bank’s Economic Policy Review (2000). She took the actual support and resistance levels that six active FX firms published to their customers, and tested whether exchange rates behaved differently on reaching them than on reaching 10,000 sets of arbitrarily chosen levels. They did. The published levels significantly predicted intraday trend interruptions, though the strength varied by pair and by firm.
How both are true
The Tsinaslanidis result says the ratios have no intrinsic power. The Osler result says levels that a large number of market participants are watching and placing orders at do have power. Osler herself later made the mechanism explicit in Currency Orders and Exchange-Rate Dynamics (Journal of Finance, 2003): the effect is order flow — clustered stops and take-profits — not geometry.
The practical implication inverts most Fibonacci teaching. If the edge comes from crowding rather than from the number, then the levels worth trading are the obvious ones drawn from the obvious swing on the obvious timeframe — the grid the largest number of other traders are also looking at. Hunting for hidden confluence on an unusual anchor is hunting for a level that nobody else is watching, which is precisely the level with no order flow behind it.
Four complications specific to forex
Server time and the daily close. As covered in the Bollinger Bands article, your broker’s daily candle boundary — 5pm New York, midnight GMT, or something else entirely — determines your daily high and low. Two traders at different brokers, both anchoring to “yesterday’s daily swing,” draw different grids. Weekly and monthly anchors are considerably more stable and should be preferred for any level you intend to hold a position against.
No real volume. An equity trader can check whether a level coincides with a high-volume node. In spot forex you have tick volume, which counts price changes rather than contracts. It is a reasonable proxy for activity but not for participation, and it will not tell you where size actually traded.
Round numbers dominate. In FX, levels like 1.1000 and 1.1050 carry genuine option-barrier and stop-order density. When a Fibonacci level lands within a few pips of a round number, the round number is doing the work and the Fib is taking the credit. Check before you attribute.
Cross rates are second-hand. A grid on EUR/GBP is anchored to swings produced by the interaction of two other markets’ order flows. The anchors are less clean and the crowding effect is weaker. Majors first.
Retracement, extension, projection: three tools, endless confusion
These get used interchangeably and they are not the same thing.
Retracement takes two points and draws levels inside the move. Used to find pullback entries.
Extension takes the same two points and draws levels beyond the move — 127.2%, 161.8%, 261.8%. Used for targets on the original leg.
Projection (called expansion on some platforms) takes three points: it measures the impulse leg, then applies that distance from the end of the correction. This is the tool Elliott traders use for wave targets, and it is a genuinely different calculation from an extension.
Platform naming is inconsistent enough to cause real errors. MetaTrader’s “Fibonacci Expansion” is TradingView’s “Trend-Based Fib Extension.” If you are following someone else’s analysis, confirm which tool produced the number before you trade off it.
Fibonacci Retracement Forex
Fibonacci Retracement Forex – How to actually use it
Treat it as a location tool, never a signal. Fibonacci tells you where to look. It never tells you when to enter. A level touched is not a trade; a level touched plus a reversal signal you would have taken anyway is a trade with better location.
Require a trigger. Candlestick reversal, momentum divergence, structure break on a lower timeframe — whatever your method already uses. If your entry criteria are satisfied only by “price reached 61.8%,” you do not have entry criteria.
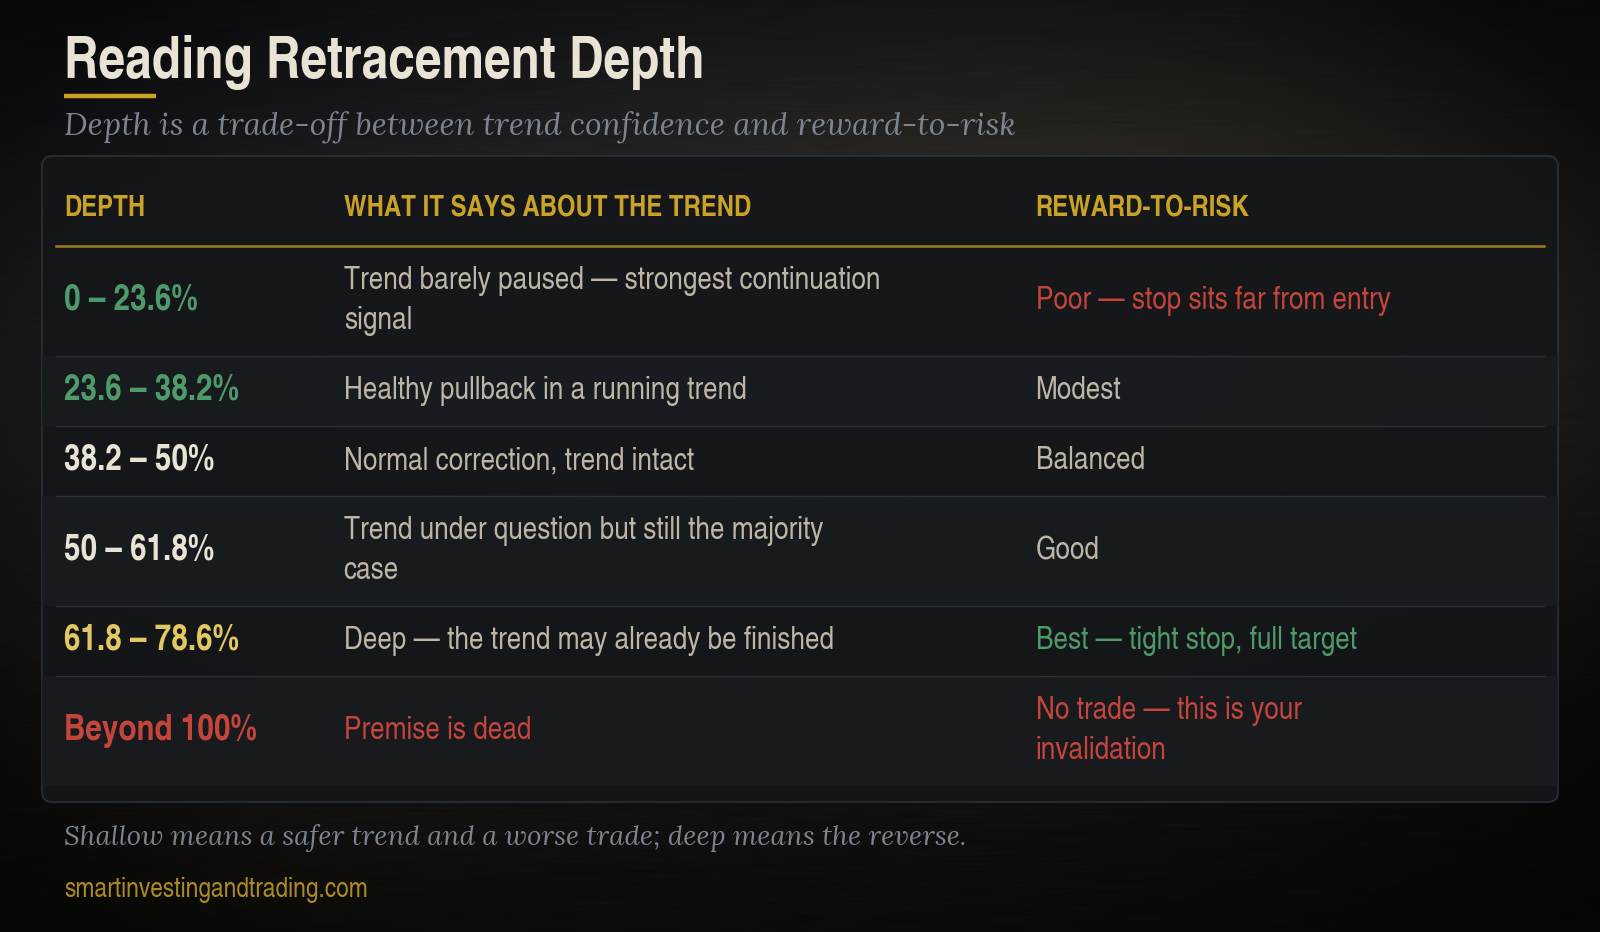
Use it for the stop, which is where it genuinely earns its place. The invalidation is objective and requires no judgement: beyond the 100% level, the premise is dead. That gives you a defined risk, a defined R multiple, and a reason to exit that was decided before you entered. Most tools cannot offer that.
Read the depth as information. A trend that pulls back only to 23.6% or 38.2% is showing strength; entries there are lower risk in trend terms but poorer in reward terms. A pullback to 61.8% or 78.6% offers a far better reward-to-risk ratio and a materially higher chance the trend is finished. That trade-off is the real content of the retracement depth, and it is more useful than any claim about which level “holds” more often.
Skip the fans, arcs and time zones. Fibonacci time zones in particular have an arbitrary starting point and spacing that widens as you move right, which makes a hit eventually inevitable. There is no evidence base for any of them and they add drawing decisions to a tool that already has too many.
Fibonacci Retracement Forex – The bottom line
The ratios are real mathematics. The claim that markets obey them is not supported by the evidence. The claim that levels many traders watch together attract order flow is supported, and it is the only honest justification for keeping the tool on your chart.
That justification has a clear implication: draw the obvious grid on the obvious swing, use it to locate rather than to decide, take your stop from the 100% line, and stop looking for the level nobody else can see. In a tool this subjective, discipline about the anchor is worth more than any argument about the ratio.
Frequently asked questions
Is 50% a Fibonacci retracement level? No. Fifty percent does not appear in the Fibonacci sequence and is not derived from it. It entered technical analysis through Dow Theory and Gann’s work on halves and eighths. Later it was included in Fibonacci toolsets by convention. It remains one of the most-watched levels on any chart, but it is not a Fibonacci ratio.
Do Fibonacci retracements actually work? The evidence says the ratios themselves have no predictive power. Tsinaslanidis, Guijarro and Voukelatos (2022) found prices no more likely to turn at Fibonacci levels than at random ones. However, Osler’s Federal Reserve Bank of New York study (2000) found that support and resistance levels widely published to FX traders did predict intraday trend interruptions. The effect appears to come from clustered orders, not from mathematics.
Fibonacci Retracement Forex
What are the correct Fibonacci retracement levels? 23.6%, 38.2%, 61.8% and 78.6% are derived from the sequence. 50% is included by convention but is not a Fibonacci ratio. On the extension side, 127.2%, 161.8% and 261.8% are the standard levels.
Is 78.6% or 76.4% correct? 78.6% is the square root of 0.618 and is the geometrically coherent level. 76.4% is simply 1 − 0.236 and appears on many platforms as a convention. Both are in use; 78.6% has the better derivation.
Should I draw Fibonacci from wicks or candle bodies? There is no correct answer, only a consistent one. Wick-to-wick captures the true extremes; body-to-body ignores single-print spikes. Choose one, write the rule down, and never switch mid-analysis — the difference can exceed twenty pips at every level.
What is the best timeframe for Fibonacci in forex? Weekly and daily anchors are more reliable than intraday ones. Partly because more traders watch them and partly because broker server-time differences distort intraday swing highs and lows between platforms.
Trading foreign exchange on margin carries a high level of risk and is not suitable for all investors. Nothing in this article constitutes investment advice.


Add comment