

How to Calculate Trading Probability the Right Way (Not the Marketing Way)
How to Calculate Trading Probability
Open any trading forum, YouTube ad, or Telegram channel and you’ll see the same pitch: a signal service, a bot, or a “proven system” boasting a win rate of 80%, 90%, sometimes higher. It’s the single most common hook used to reel in inexperienced traders who are chasing a dream of making it big in the markets.
Here’s the problem: most of those numbers are meaningless. Not necessarily because they’re fabricated (though plenty are), but because they’re calculated on samples so small, so cherry-picked, or so conveniently timed that the “probability” being advertised has almost nothing to do with what you’ll actually experience trading that system in real time.
Before we get into trend lines, indicators, or chart patterns, every trader needs to understand what probability actually is, how to calculate it honestly, and — just as importantly — why a great win rate alone won’t save you if your risk management is broken. This is the foundation everything else in trading is built on.
Why “70% Win Rate” Claims Are Usually Meaningless
I’m not going to spend this article explaining every trick vendors use to inflate their numbers — that’s a separate conversation. What matters right now is this: to get a statistically meaningful result, you need a large sample of data. Not a few good weeks. Not a lucky month. A real sample.
A handful of winning trades doesn’t prove a system works — it proves you caught a favorable stretch of the market. And once that stretch ends, the results can look completely different.
How to Calculate Trading Probability
The Minimum Sample Size You Actually Need
Let’s work through a realistic example.
Say you trade the 5-minute chart, and your strategy produces about 3 entry signals per day. The market is open 5 days a week, which gives you roughly 15 trades per week.
To get a statistically reliable read on that system, you should be looking back at a minimum of 1,000 trades — not 1,000 chart candles, 1,000 actual completed trades.
At 15 trades per week, that works out to:
1,000 trades ÷ 15 trades per week ≈ 67 weeks, or roughly a year and a half of trading history.
That’s the real homework. Not two weeks. Not two months. A year and a half, minimum, and every single trade counted — no exceptions.
The Rule: No Cheating the Backtest
When you go back through your history, you have to log every single trade the system generated — win, lose, ugly. No skipping the ones you “would have known” not to take. No excluding the trade that “was obviously a bad setup in hindsight.” That kind of selective memory doesn’t make your system look better; it just means you’re lying to the one person the lie actually hurts: you.
Why Small Sample Sizes Lie to You
Trading on a small data set is one of the most common — and most expensive — mistakes new traders make, for a few specific reasons:
- You might just be riding one good trend. A few weeks of strong results can simply mean the market conditions happened to favor your strategy. Once that trend shifts, performance can flip entirely.
- You can’t see your real losing streaks. A small sample won’t show you how many consecutive losses your system is actually capable of producing — and that number is critical for surviving the strategy in live conditions.
- You can’t spot the weaknesses. A large sample lets you see exactly where the system breaks down, what conditions it struggles in, and whether it’s actually viable long-term — or just a temporary hot streak.
Nobody enjoys digging through their own losing trades. But trading isn’t a hobby where you get to protect your feelings — the market doesn’t care how confident you are, and neither should your backtest.
How to Actually Calculate Trading Probability
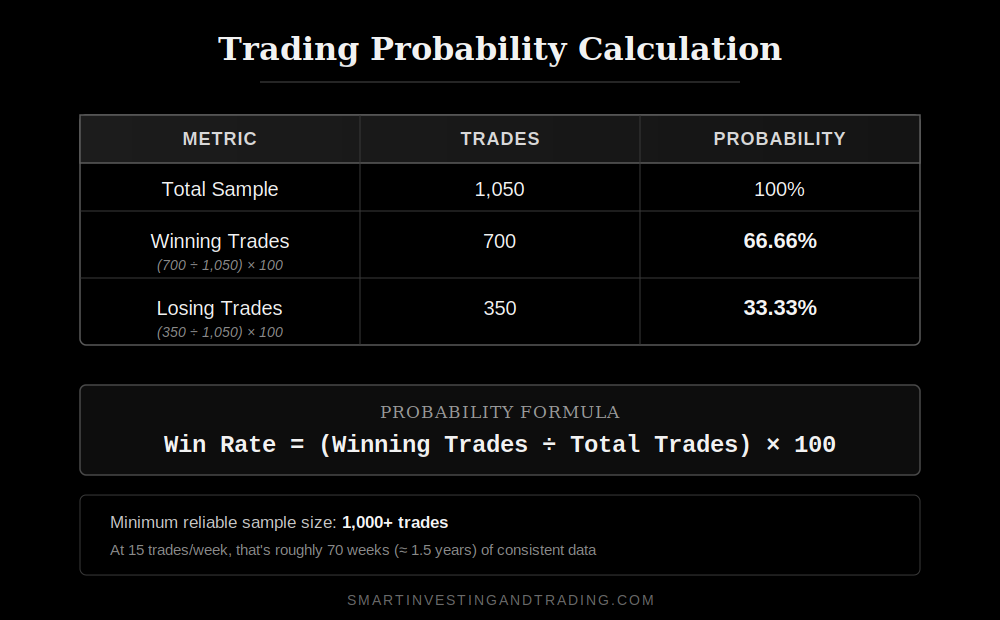
Once you’ve built a proper sample, the math is simple. Here’s a worked example using the 1,000-trade minimum from above.
Sample size: 1,050 completed trades (15 trades/week × 70 weeks)
Results:
- 700 winning trades
- 350 losing trades
Win probability: (700 ÷ 1,050) × 100 = 66.66%
Loss probability: (350 ÷ 1,050) × 100 = 33.33%
That’s it — that’s the actual formula. Winning trades divided by total trades, multiplied by 100. No smoke, no mirrors, no cherry-picked date range.
Why a Good Win Rate Still Isn’t Enough
Here’s where most traders get it wrong, and it’s the part the signal-sellers never mention.
A 66.66% win rate does not mean “roughly 7 out of every 10 trades will win, evenly spread out.” Probability doesn’t distribute itself neatly like that. It’s entirely possible — even statistically expected, over a long enough sample — to hit 10 losing trades in a row, even inside a system with a strong overall win rate.
This is where risk management becomes the difference between a strategy that survives and one that blows up your account.
If you’re sizing positions aggressively — say, 5% of your total margin per trade, or worse — a losing streak that’s completely normal for your system’s probability profile can wipe out your account before the law of averages ever has a chance to catch up. And once your margin is gone, you can’t open the same size position again. That’s the start of what I call the Trading Death Spiral: shrinking capital forcing shrinking position sizes, forcing you to need even bigger winners just to recover, which usually pushes traders into even riskier bets.
A high win rate feels like safety. It isn’t, on its own. It’s just one input.
What Proper Homework Actually Tells You
If you build your sample correctly and calculate your probability honestly, you walk away knowing four things that matter far more than the headline win-rate number:
- Your longest realistic losing streak — so it doesn’t blindside you emotionally or financially when it happens.
- How the system behaves when the trend changes — because every strategy is optimized for certain conditions, and none work in all of them.
- Your appropriate position size — sized to survive your actual losing streaks, not your best-case scenario.
- Whether the system genuinely works — over a real sample, not a lucky stretch.
Yes, a higher probability generally means more chances to win — that part’s simple. Trading is, at its core, a game of chances, and probability sits at the center of it. But probability is only one piece of the full framework. It means nothing without the risk management, stop-loss discipline, and position sizing built around it.
What’s Next
Notice that this entire discussion didn’t touch a single trend line, indicator, or chart pattern. That’s intentional. Before any of that matters, you need the foundation: understanding probability, building an honest sample, and respecting what the numbers are actually telling you.
From here, we’ll build out the rest of the Trading Construction step by step — risk management, stop-loss placement, profit targets, and position sizing — so that by the time you are looking at a chart, you already know how to survive being wrong.
Bobby Jovanovski has over 35 years of experience in trading, technical and political analysis, and the development of charting and trading systems, with a background rooted in Forex, precious metals, and bonds. He shares practical, no-nonsense trading education at smartinvestingandtrading.com.


Add comment