

Trade Analyzer: A Practical Guide to Evaluating Your Trades
Trade Analyzer
Every trader eventually hits the same wall: gut instinct only gets you so far. You can feel confident about a setup and still lose money, or feel nervous about a trade that turns out to be a winner. The gap between “how a trade felt” and “how a trade actually performed” is exactly what a trade analyzer is built to close.
What Is a Trade Analyzer?
A trade analyzer is a tool — anything from a simple spreadsheet to a sophisticated piece of software — that evaluates trades before, during, or after execution. It takes raw inputs like entry price, exit price, position size, stop-loss level, and holding period, and turns them into decision-useful numbers: risk-to-reward ratio, expected value, win rate, drawdown, and more.
At its core, a trade analyzer answers one question traders often skip: is this a good trade, independent of whether it happened to work out?
Why Outcome Isn’t the Same as Quality
One of the most common mistakes in trading is judging a decision by its result. A trade can be well-reasoned, properly sized, and executed with a sound risk-to-reward ratio — and still lose, simply because markets are probabilistic. Conversely, a poorly planned trade can still make money by luck.
A trade analyzer helps separate process from outcome by forcing the numbers onto the table before emotion enters the picture. Over enough trades, the quality of the process is what determines long-term results — not any single win or loss.
Core Components of a Trade Analyzer
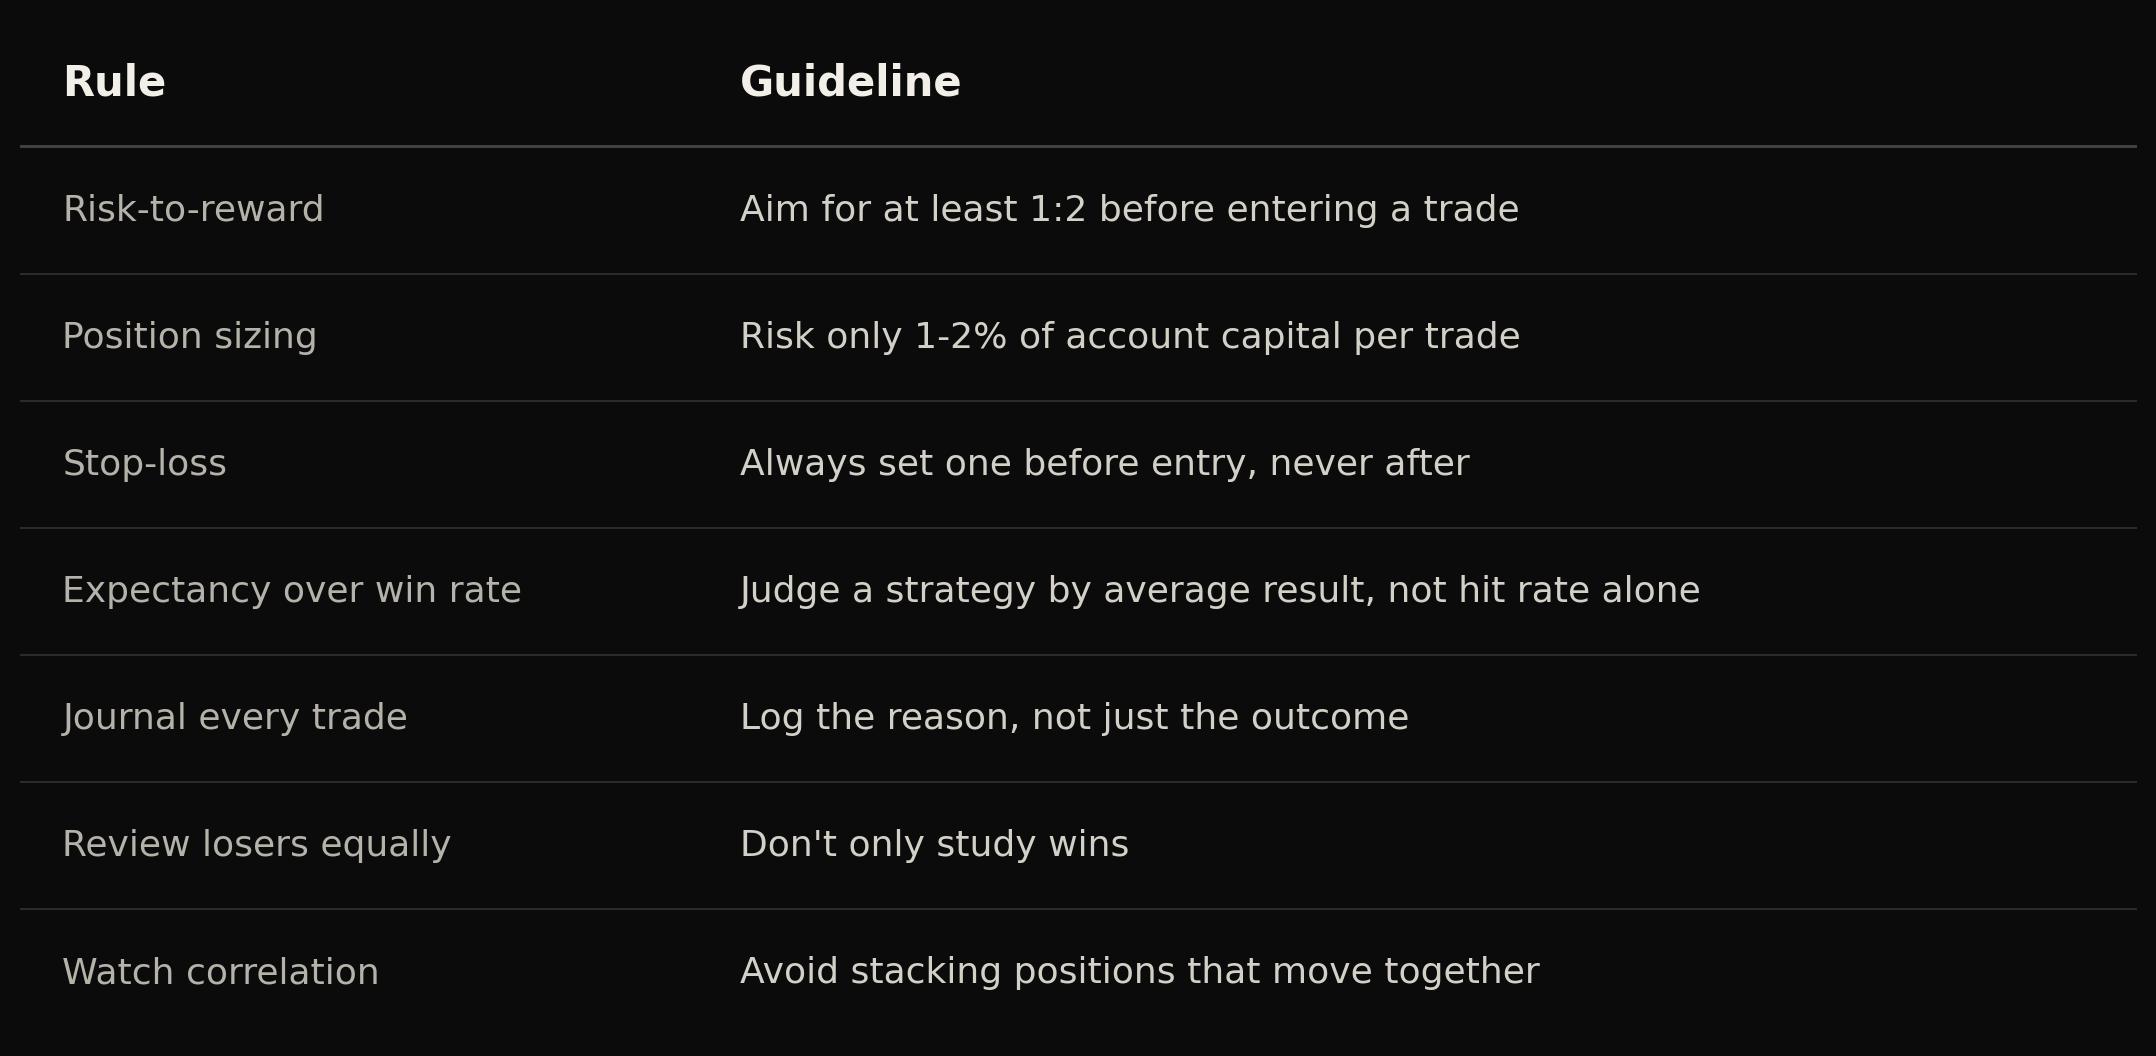
1. Risk-to-Reward Ratio This compares how much you stand to lose (distance from entry to stop-loss) against how much you stand to gain (distance from entry to target). A common threshold traders look for is at least 1:2 — risking one dollar to potentially make two.
2. Position Sizing Even a great setup can wreck an account if the position is too large. A good analyzer calculates position size based on account risk tolerance, typically expressed as a percentage of total capital risked per trade (often 1–2%).
3. Win Rate and Expectancy Win rate alone is misleading. A strategy that wins 30% of the time can still be highly profitable if winners are large and losers are small. Expectancy — the average amount won or lost per trade — combines win rate and risk-to-reward into a single, more meaningful figure.
4. Historical Performance Metrics For traders analyzing past trades, key metrics include maximum drawdown, average holding period, profit factor (gross profit divided by gross loss), and consistency across different market conditions.
5. Correlation and Exposure More advanced analyzers check whether a new trade adds unwanted correlation to an existing portfolio — for example, opening five different tech positions that all move together, quietly multiplying risk without anyone noticing.
Types of Trade Analyzers
- Pre-trade calculators: Used before entering a position, focused on position sizing and risk-to-reward.
- Post-trade journals: Log completed trades and calculate performance statistics over time, often revealing patterns a trader wouldn’t otherwise notice.
- Backtesting engines: Apply a defined strategy to historical price data to see how it would have performed, useful for testing an idea before risking real capital.
- Real-time screening tools: Scan live markets for setups matching specific technical or fundamental criteria.
Each type solves a different problem, and many serious traders use a combination — a pre-trade calculator to size the position, and a post-trade journal to review decisions later.
Building the Habit, Not Just the Tool
The tool itself is only half the value. The other half is discipline: using the analyzer consistently, before emotion takes over, rather than after a trade has already gone wrong. Traders who journal every trade — win or lose — tend to improve faster, because patterns that are invisible trade-by-trade become obvious across twenty or fifty entries.
A few habits worth pairing with any trade analyzer:
- Record the reason for the trade, not just the numbers.
- Review losing trades as carefully as winning ones.
- Track expectancy over a rolling window (e.g., last 30 trades) rather than judging any single result.
- Revisit position sizing rules regularly as account size changes.
The Bottom Line
A trade analyzer won’t predict the market and it won’t remove risk. What it does is make risk visible and decisions repeatable. In a game where small edges compound over hundreds of trades, that visibility is often the difference between a trader who survives long enough to get good, and one who doesn’t.
Where to Go From Here
Adopting a trade analyzer isn’t a one-time setup — it’s an ongoing relationship with your own data. The traders who benefit most treat it as a feedback loop: plan the trade, log the numbers, execute, then come back afterward and compare what actually happened against what the plan predicted. That loop, repeated across dozens or hundreds of trades, is what eventually turns scattered experience into a coherent edge.
It also helps to resist the urge to overcomplicate things early on. A trader just starting out doesn’t need a dashboard with twenty metrics — they need three or four numbers tracked consistently: risk-to-reward, position size, win rate, and expectancy. Complexity can be added later, once the basics are second nature and the data actually justifies it. Adding sophistication before the fundamentals are solid usually just hides bad habits behind more impressive-looking spreadsheets.
It’s also worth remembering that no analyzer, however well built, replaces judgment. Markets shift, correlations break down, and strategies that worked for a year can quietly stop working. The numbers a trade analyzer produces are inputs to a decision, not a replacement for one. Traders who treat their tools as infallible often get blindsided precisely when conditions change fastest.
Finally, the value of a trade analyzer compounds with time. A single week of data tells you almost nothing. A single quarter starts to reveal patterns. A full year of consistent logging is often what finally shows a trader where their real edge lies — and just as importantly, where it doesn’t. Patience with the process, more than any specific formula, is what separates traders who improve from those who simply keep repeating the same mistakes with new tickers.
For a broader look at evaluating trading risk from a regulatory perspective, the U.S. Securities and Exchange Commission’s investor education site offers a useful starting point
Investor.gov
Daily Tips


Add comment