

Trading Charts and Cheat Sheets: Candlesticks, Positional Setups, and Swing Trading
Trading Chart Patterns Cheat
Reading a chart is a visual skill before it’s an analytical one. Long before you calculate a risk-reward ratio or size a position, your eye needs to recognize a handful of recurring shapes . A candle, a crossover, a channel — quickly and correctly. This article pulls together three reference sheets: candlestick patterns, positional trading setups, and swing trading setups. It explains what each one is actually telling you.
Part 1: Candlesticks — the alphabet of price action
Every trading strategy, no matter the timeframe, is built on candles. Before you can trade a breakout or a swing setup, you need to read the candles that make it up.
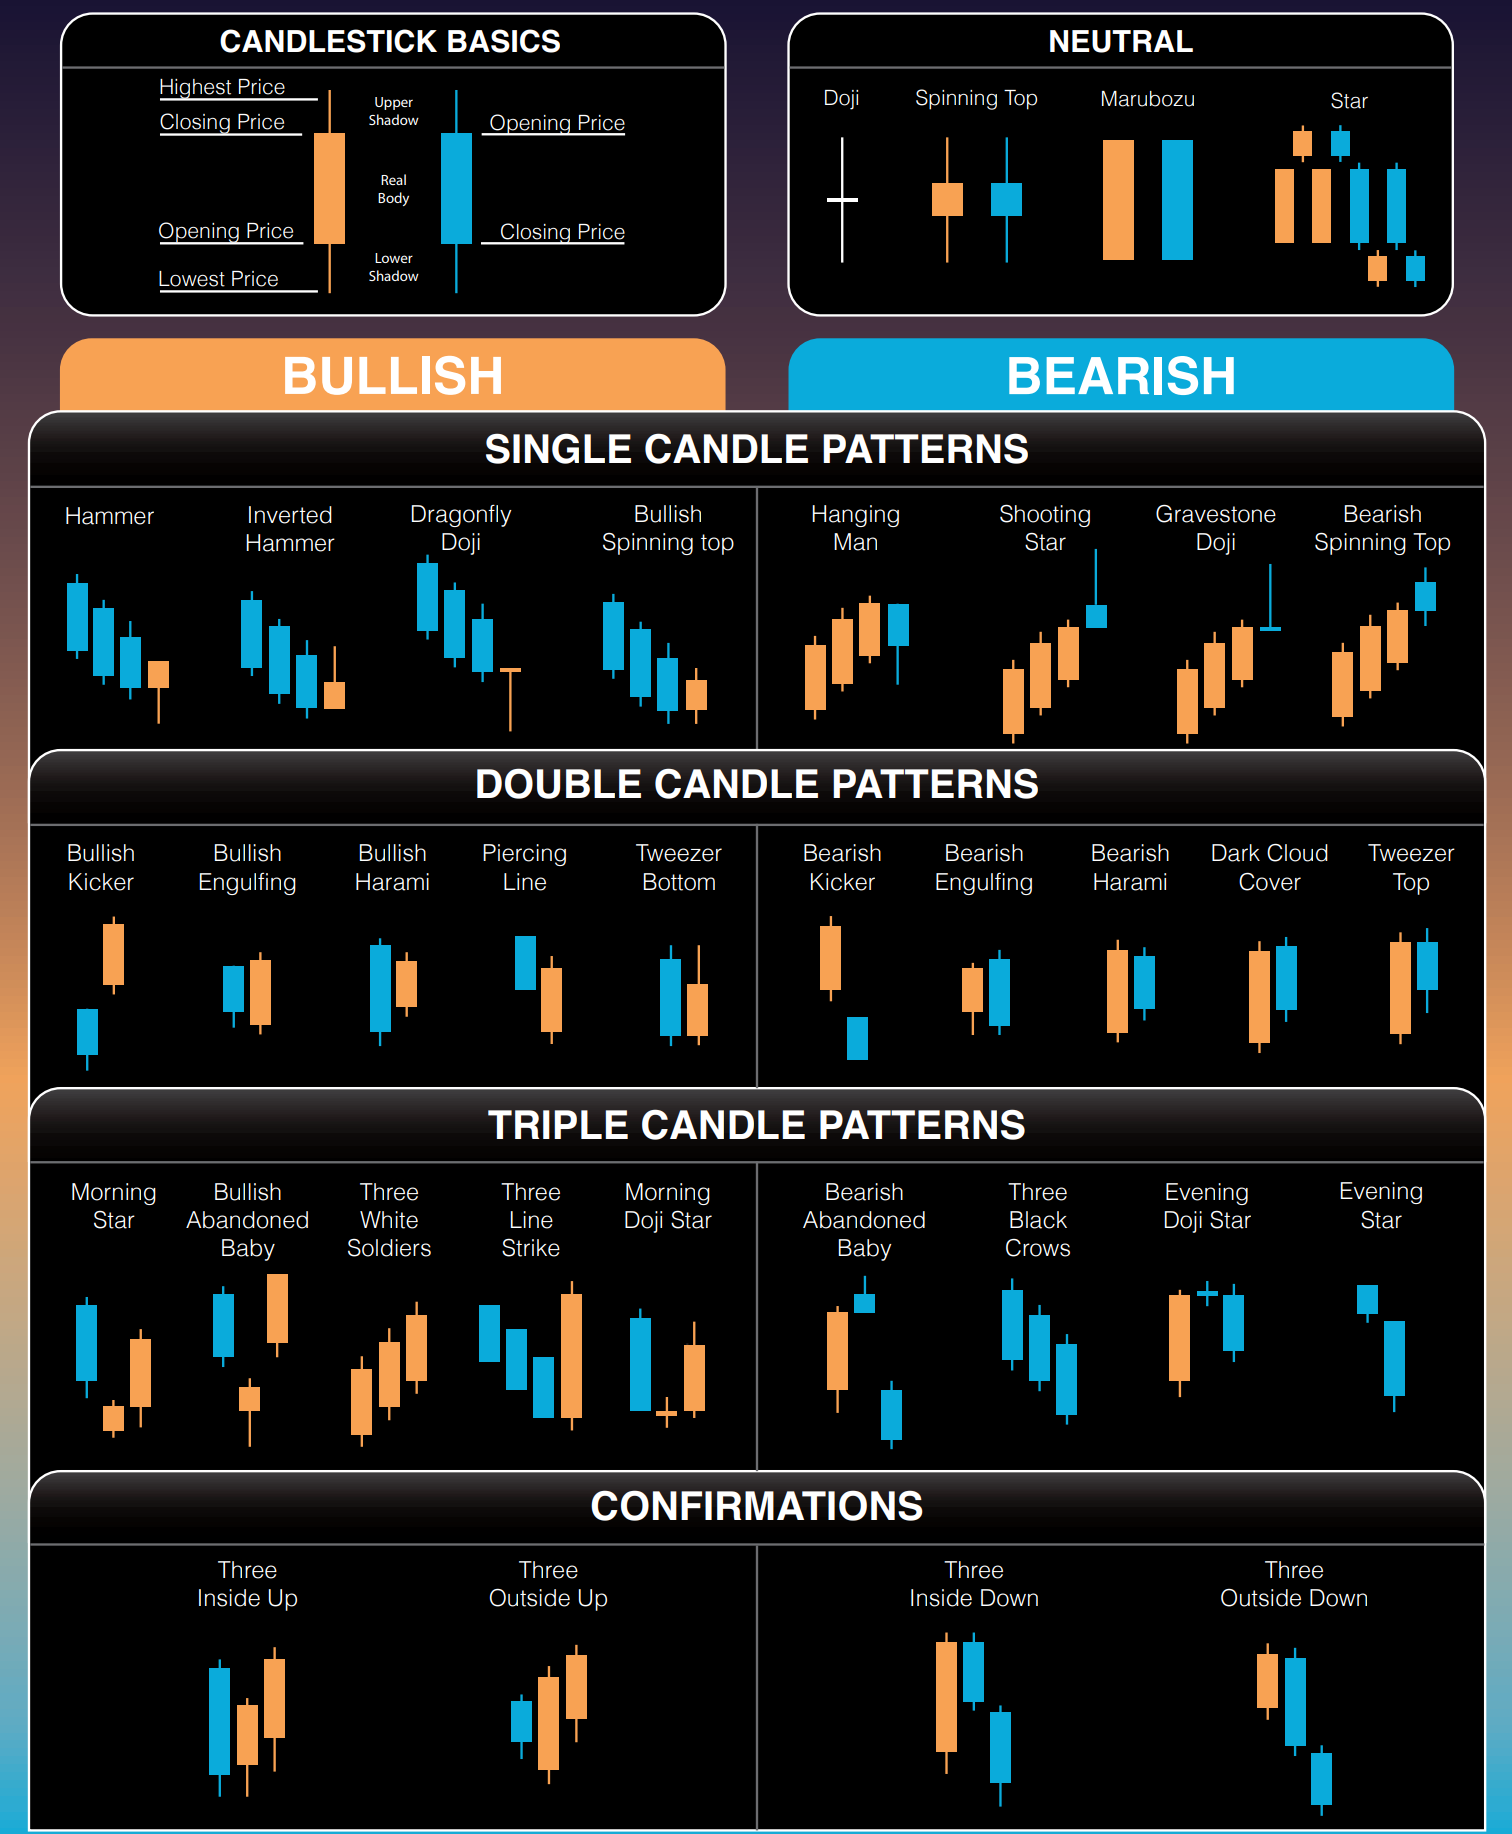
Bullish reversal signals
- Hammer — a small body sitting near the top of the candle’s range, with a long lower wick and little or no upper wick. It shows that sellers pushed price down hard during the session, but buyers stepped in and clawed almost all of it back.
- Bullish engulfing — a small red (down) candle followed by a larger green (up) candle whose body fully swallows the one before it. It signals that buyers have taken firm control after a period of selling.
- Morning star — a three-candle sequence: a large red candle, a small indecisive candle (often a doji), then a large green candle. It reads like a story — selling, hesitation, then a decisive turn upward.
Bearish reversal signals
- Shooting star — the mirror image of a hammer: a small body near the bottom of the range with a long upper wick. Buyers tried to push higher and were firmly rejected.
- Bearish engulfing — a small green candle followed by a larger red candle that completely engulfs it. Sellers have taken over.
- Evening star — the bearish version of the morning star: a strong up candle, an indecisive middle candle, then a strong down candle.
Indecision and continuation signals
- Doji — the open and close are almost identical, so the body is razor-thin. It represents a standoff between buyers and sellers.
- Spinning top — a small body with wicks of roughly equal length on both sides. Similar meaning to a doji, slightly less extreme.
- Harami — a large candle followed by a small candle whose entire range is contained inside the previous one. It suggests the prior move is losing momentum.
The one rule that matters most: if a real-time pattern is close but not textbook-clean — a wick that’s a little too short, a body that’s a little too large — skip it. The patterns that require you to talk yourself into seeing them are exactly the ones that fail most often. Waiting for the next candle to confirm the move, rather than acting on the pattern candle itself, filters out a lot of false signals.
Trading Chart Patterns Cheat
Part 2: Positional trading — playing the bigger trend
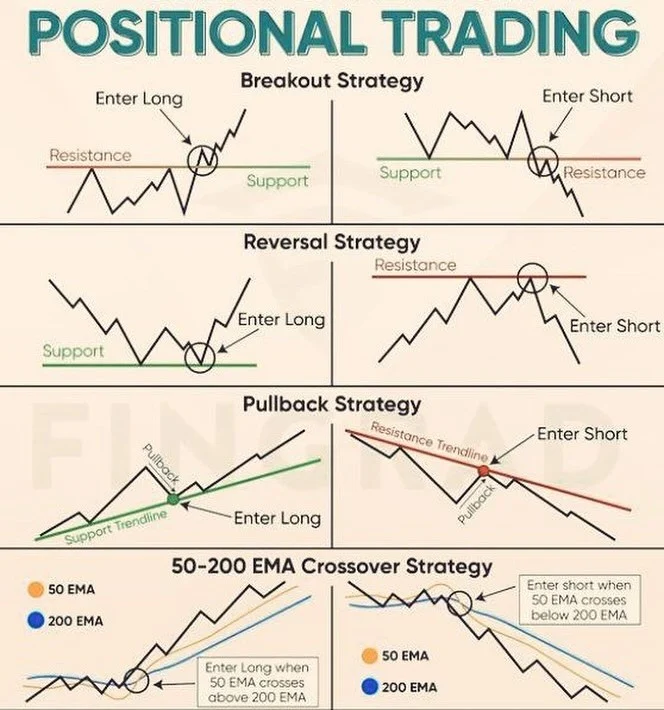
Positional trades are held for weeks or months, so the entry criteria need to be about the durability of a move, not its speed. Four setups do most of the work here.
Breakouts. Price consolidates below a resistance level, then clears it with force. The setup only means something if it comes with a volume spike — a breakout on thin volume is the textbook fake-out, where price pokes above resistance and immediately falls back below it.
Moving average crossovers. When a faster moving average crosses above a slower one (a “golden cross”), it signals that short-term momentum has turned in favor of the trend. The tradeoff is that MAs are lagging indicators by construction — they confirm a trend that has already started, they don’t predict the turn.
Trendline following. An ascending trendline gets tested repeatedly, and each successful bounce reinforces that buyers are defending it. The setup lives and dies by one rule: once price closes clearly through the line, it’s broken. It is not “due for one more bounce” — that’s hope, not analysis.
Reversals. A trend exhausts itself and turns the other way. This is the hardest of the four to trade well, because the same visual can appear many times before a real reversal happens. Waiting for a confirmed higher low (in an uptrend reversal) or lower high (in a downtrend reversal) means giving up some of the early move, but it dramatically cuts down on false starts.
Trading Chart Patterns Cheat
Part 3: Swing trading — capturing the move in between
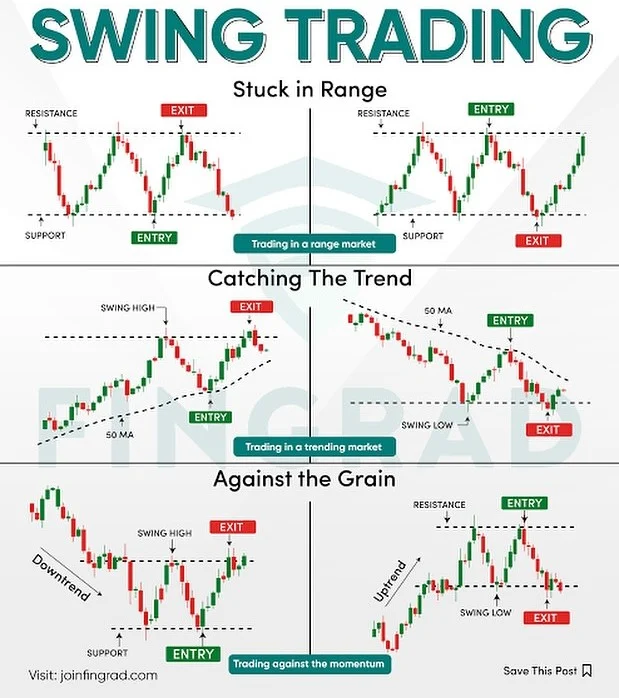
Swing trades sit between day trading and positional trading — typically held for a few days to a few weeks. The setups below are built around catching a move that’s already underway, at a point where the risk is well-defined.
Pullback entries.
In an uptrend, price rarely moves in a straight line — it advances, then dips back toward a moving average or prior support before continuing. Buying that dip means entering at a discount within an established trend. The important caveat: the dip has to hold the support level. If price slices through it, that’s not a pullback anymore — the trend itself may be changing.
Flag and pennant continuation.
A sharp, steep move (the “pole”) is followed by a tight, slightly counter-sloping consolidation channel (the “flag”), which then resolves with a breakout in the original direction. The strength of the pole matters as much as the flag — a tidy little consolidation channel without a strong prior move behind it isn’t really a flag, it’s just chop.
Fibonacci retracement.
After an impulsive move, price often retraces to a specific ratio of that move. Commonly 38.2%, 50%, or 61.8% — before resuming in the original direction. Fibonacci levels work best as a zone to watch, not a signal on their own. Combining the level with a candlestick pattern or a volume clue at that price is far more reliable than buying purely because a number was touched.
Momentum divergence.
Price makes a higher high, but an oscillator like RSI makes a lower high at the same time. That is a sign that the move up is losing underlying strength even as price keeps climbing. Divergence is a warning, not a trigger. Price can stay in an uptrend for a surprisingly long time after a bearish divergence appears. So it’s better used to tighten stops or reduce size than to jump into a short outright.
Trading Chart Patterns Cheat
Pulling it together
None of these tools work in isolation, and none of them are meant to replace judgment with a checklist. A hammer candle at the bottom of a downtrend, near a well-respected trendline, on rising volume, is a very different signal than the same hammer sitting in the middle of a directionless range. The cheat sheets are for recognition — spotting the shape quickly and correctly. What you do with that recognition still depends on context: the trend, the volume, the level, and your own risk tolerance.
And the advice that applies across every one of these setups, from a single candle to a multi-week trendline.
If it’s close but not clean, skip it. The cost of missing a marginal setup is small. The cost of forcing one isn’t.
This article is for educational purposes and reflects general technical analysis concepts — it isn’t personalized trading or investment advice. Markets carry risk, and past patterns don’t guarantee future outcomes.


Add comment