

Fundamental Analysis Explained
What Is Fundamental Analysis?
Fundamental Analysis Explained
Fundamental analysis is a method of evaluating a security — most commonly a stock — by examining the underlying business and economic factors that affect its value. Rather than studying price charts and trading patterns, fundamental analysts try to answer a simpler question: what is this company actually worth?
The core idea is that a company’s stock price and its “intrinsic value” (the true worth of the business) don’t always match. Markets can overreact to news, get caught up in hype, or overlook a solid company simply because it isn’t fashionable. Fundamental analysis is the toolkit for spotting that gap — buying when a stock trades below its intrinsic value, and avoiding (or selling) when it trades well above it.
This approach sits in contrast to technical analysis, which focuses on price action, volume, and chart patterns to predict short-term moves. Fundamental analysis takes the long view, asking whether a business is healthy, growing, and reasonably priced.
Fundamental Analysis Explained
The Two Levels of Analysis
Fundamental analysis typically works from the outside in:
1. Top-Down Analysis
This starts broad and narrows down:
- Macroeconomic conditions — interest rates, inflation, GDP growth, employment
- Industry analysis — is the sector growing or shrinking? Who are the competitors? What are the entry barriers?
- Company analysis — how does this specific business stack up within its industry?
2. Bottom-Up Analysis
This starts with the individual company and works outward, focusing on the business itself first — its products, management, and financials — before considering how industry and macro trends might affect it.
Most serious investors blend both approaches.
Core Components of Fundamental Analysis
Financial Statements
Three documents form the backbone of company-level analysis:
- Income Statement — shows revenue, expenses, and profit over a period. Reveals whether the company is actually making money and how efficiently.
- Balance Sheet — a snapshot of assets, liabilities, and shareholder equity at a single point in time. Shows what the company owns versus what it owes.
- Cash Flow Statement — tracks actual cash moving in and out through operating, investing, and financing activities. Profit on paper isn’t the same as cash in the bank, which is why this statement matters so much.
Key Financial Ratios
Ratios turn raw numbers into comparisons that mean something:
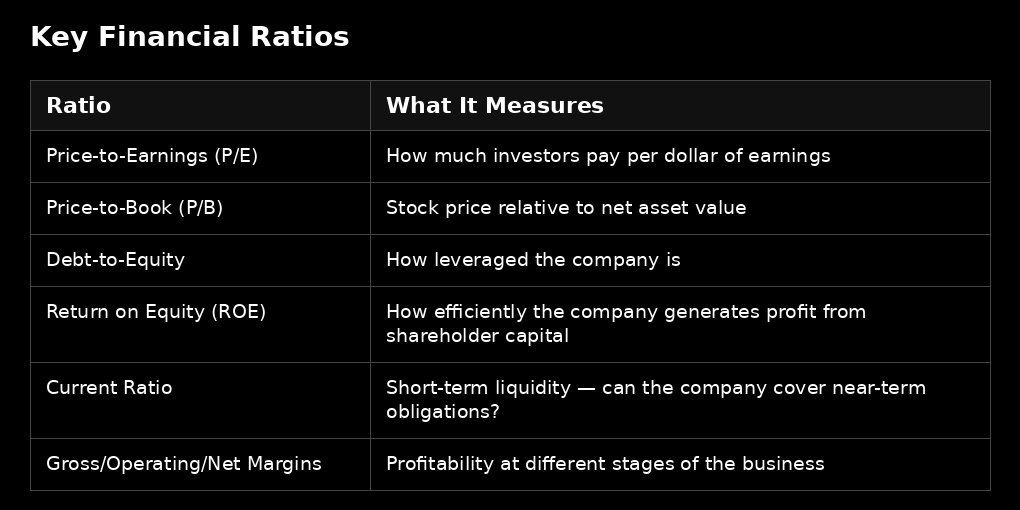
No single ratio tells the whole story. A low P/E might signal a bargain — or it might signal that the market correctly expects trouble ahead. Ratios are most useful compared against a company’s own history and against industry peers.
Qualitative Factors
Numbers only go so far. Analysts also weigh:
- Business model — how does the company actually make money, and is that durable?
- Competitive advantage (“moat”) — brand strength, patents, network effects, switching costs, or economies of scale that protect profits from competitors
- Management quality — track record, capital allocation decisions, insider ownership, transparency
- Corporate governance — board structure, executive incentives, shareholder rights
- Industry position — market share trends, pricing power, regulatory exposure
Estimating Intrinsic Value
Once the research is done, analysts try to translate it into a number. Common methods include:
- Discounted Cash Flow (DCF) — projects future cash flows and discounts them back to present value using a required rate of return. Highly sensitive to the assumptions fed into it.
- Comparable Company Analysis — values a company relative to similar businesses using ratios like P/E or EV/EBITDA.
- Dividend Discount Model (DDM) — values a stock based on the present value of expected future dividends; best suited to stable, dividend-paying companies.
Each method has trade-offs. DCF is theoretically rigorous but assumption-heavy; comparables are quick but only as good as the peer group chosen; DDM works poorly for companies that don’t pay dividends.
Strengths and Limitations
Strengths:
- Grounded in the actual economics of a business, not just price movement
- Well-suited to long-term investing and identifying mispriced assets
- Provides a framework for reasoning about risk, not just return
Limitations:
- Time-intensive — requires digging through financial statements and filings
- Relies on estimates and assumptions (especially in valuation models) that can be wrong
- Doesn’t account well for short-term sentiment, momentum, or market timing
- Financial statements can be manipulated or present an incomplete picture (as seen in cases like Enron)
Fundamental vs. Technical Analysis
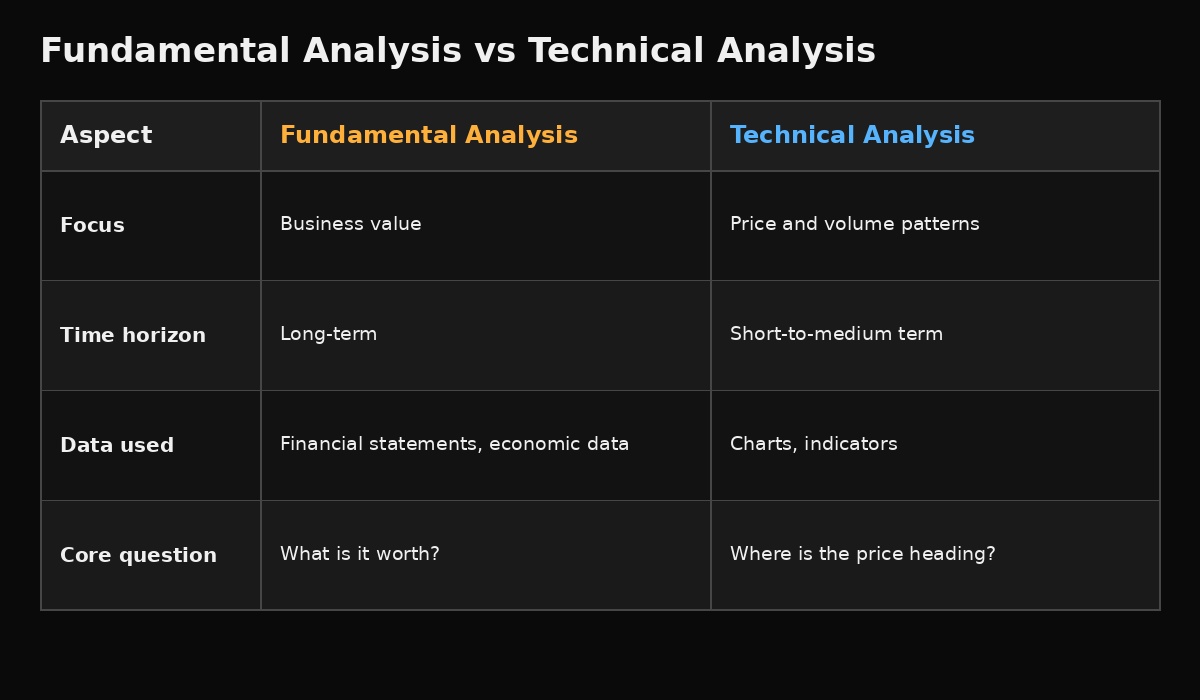
Many investors use both: fundamentals to decide what to buy, and technicals to help decide when.
Getting Started
For someone new to fundamental analysis, a practical starting point is:
- Read a company’s most recent annual report (10-K in the U.S.) and quarterly report (10-Q)
- Compare its key ratios to two or three direct competitors
- Read the “Management Discussion and Analysis” section for qualitative context
- Try a simple valuation exercise, even a rough one, to build intuition for how assumptions affect outcomes
A Note on Risk
Fundamental analysis improves the quality of investment decisions, but it doesn’t eliminate risk or guarantee returns. Markets can stay irrational longer than any model predicts, and even well-researched theses can be wrong. This article is educational in nature and isn’t personalized financial advice — for decisions about your own portfolio, consider consulting a licensed financial advisor.
Fundamental Analysis Explained


