

Understanding Economic Indicators: The Pulse of the Financial Markets
Economic Indicators
Introduction
Every month, sometimes every week, a steady stream of numbers flows out of government agencies, central banks, and private research firms. A jobs report here, an inflation reading there, a manufacturing survey somewhere in between. To the casual observer, these might look like dry statistical releases buried in the back pages of a newspaper. But to anyone involved in financial markets — traders, portfolio managers, corporate executives, policymakers, and increasingly, everyday investors — these numbers are essential intelligence. They are collectively known as economic indicators. They form the nervous system through which the health of an economy is monitored, interpreted, and, ultimately, priced into markets.
Economic indicators are snippets of financial and economic data published on a regularly scheduled basis by government agencies or private organizations. Because markets are inherently forward-looking — prices today reflect expectations about tomorrow — these releases are followed with an intensity that borders on ritual. A single report can send stock indices swinging, currencies gyrating, and bond yields lurching within seconds of release. Understanding what these indicators are, how they’re classified, and how they influence market behavior is essential for anyone trying to make sense of the financial world.
What Exactly Is an Economic Indicator?
At its core, an economic indicator is a statistic about economic activity. It allows analysts to evaluate the overall health of an economy. It forecasts future economic conditions, and understands the direction in which growth, employment, prices, or trade are heading. These indicators are compiled from surveys, administrative records, and direct measurements. Everything from the number of new unemployment claims filed in a week to the total value of goods and services produced across an entire nation in a quarter.
What makes these statistics so powerful isn’t just the raw number itself, but the context around it: how it compares to economist forecasts, how it compares to the prior period, and what it implies about the broader trajectory of the economy. A single data point rarely tells the whole story; it’s the pattern across many releases, over time, that paints a coherent economic picture.
The Three Broad Categories of Indicators
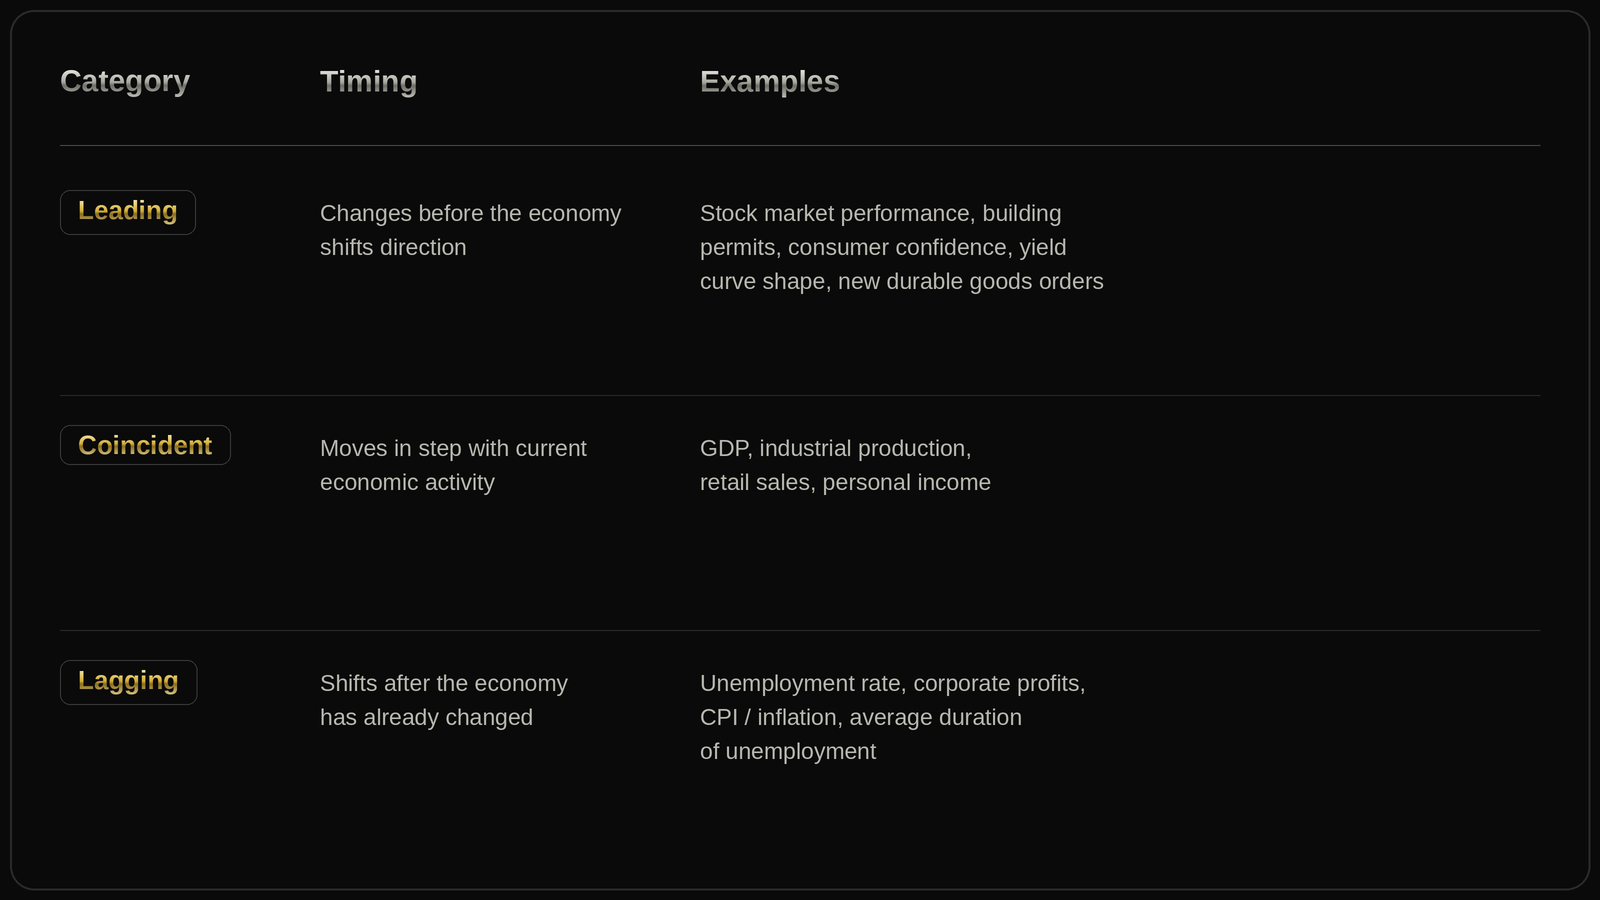
Economists generally classify indicators into three types, based on their timing relative to the broader economic cycle.
1. Leading Indicators
Leading indicators tend to change before the economy as a whole shifts direction. They are the closest thing markets have to a crystal ball, offering early signals about where growth, employment, or inflation might be headed. Because of this predictive quality, they are especially prized by traders trying to get ahead of a turning point.
Examples include:
- Stock market performance — equity markets often move in anticipation of future corporate earnings and economic conditions.
- Building permits and housing starts — construction activity today often foreshadows economic activity months down the road.
- Consumer confidence and sentiment surveys — how optimistic or pessimistic households feel about their financial future often predicts their future spending behavior.
- Yield curve shape — an inverted yield curve (where short-term rates exceed long-term rates) has historically preceded recessions.
- New orders for durable goods — a rise in orders for long-lasting manufactured goods suggests businesses expect stronger demand ahead.
2. Coincident Indicators
Coincident indicators move in step with the broader economy. They don’t predict the future so much as describe the present state of economic activity as it’s happening. These are the indicators used to define, in real time, whether the economy is expanding or contracting.
Examples include:
- Gross Domestic Product (GDP) — the broadest possible measure of economic output.
- Industrial production — output from factories, mines, and utilities.
- Retail sales — a direct read on consumer spending, which drives a large share of economic activity in most developed economies.
- Personal income — aggregate income levels across the economy.
3. Lagging Indicators
Lagging indicators shift after the economy has already changed direction. While they don’t help predict the future, they play a crucial role in confirming trends that leading and coincident indicators previously suggested — essentially validating a narrative after the fact.
Examples include:
- Unemployment rate — employers typically don’t lay off or hire in large numbers until an economic shift has been under way for some time.
- Corporate profits — earnings often take a few quarters to reflect changing economic conditions.
- Consumer Price Index (CPI) and inflation — price changes often lag behind shifts in demand and supply.
- Average duration of unemployment — this tends to peak well after a recession has technically ended.
The Most Closely Watched Indicators
While there are hundreds of economic data series published across the world, a handful command outsized attention from market participants because of their scope, reliability, and market-moving potential.
Nonfarm Payrolls and the Unemployment Rate
Released monthly by the U.S. Bureau of Labor Statistics, this report is arguably the single most anticipated economic release in American markets. It measures the change in the number of employed people, excluding farm workers, private household employees, and nonprofit organization employees. A stronger-than-expected report can signal a robust economy but may also stoke fears of inflation and tighter monetary policy; a weaker report can raise recession concerns.
Consumer Price Index (CPI)
This measures the average change in prices paid by consumers for a basket of goods and services over time, making it the most widely referenced gauge of inflation. Because central banks like the Federal Reserve set interest rate policy partly in response to inflation trends, CPI releases are scrutinized intensely by bond and currency traders in particular.
Gross Domestic Product (GDP)
Published quarterly, GDP represents the total monetary value of all finished goods and services produced within a country’s borders. It’s the broadest scorecard of economic health, and two consecutive quarters of negative GDP growth is a commonly cited (though not official) definition of a recession.
ISM Manufacturing and Services PMI
These Purchasing Managers’ Index surveys, conducted monthly, ask business leaders about new orders, production, employment, and other factors. A reading above 50 indicates expansion; below 50 indicates contraction. Because these surveys are released early each month and are highly correlated with GDP, they are treated as a timely proxy for overall economic momentum.
Retail Sales
Since consumer spending makes up a substantial share of GDP in many economies, retail sales data offers a direct, timely window into household spending behavior.
Federal Reserve Interest Rate Decisions
While not a “data release” in the traditional sense, the Federal Open Market Committee’s rate decisions and accompanying statements function as one of the most closely watched events on the economic calendar, since they directly set the cost of borrowing across the economy.
Consumer Confidence and Sentiment Indices
Surveys such as the Conference Board’s Consumer Confidence Index or the University of Michigan’s Consumer Sentiment Index gauge how optimistic households feel, which often foreshadows future spending patterns.
Why Markets React So Strongly
Financial markets are pricing mechanisms that continuously digest new information. Asset prices — whether for stocks, bonds, currencies, or commodities — reflect the collective expectations of millions of participants about future economic conditions and corporate performance. When an economic indicator is released, it doesn’t just provide new information; it often confirms or contradicts what was already priced in.
This is why the market reaction to an economic report often depends less on whether the number is “good” or “bad” in absolute terms. It is more on how it compares to consensus expectations. A jobs report showing solid job growth might still trigger a market sell-off if it comes in well below what economists had forecast, because it forces a rapid repricing of assumptions. Conversely, a seemingly weak number that beats deeply pessimistic expectations can spark a rally.
Additionally, because monetary policy decisions — like whether central banks raise or lower interest rates — are heavily influenced by economic data, indicators serve as inputs into the market’s expectations about future interest rates. Interest rate expectations, in turn, ripple through virtually every asset class. Higher expected rates generally weigh on stock valuations and boost currency strength, while lower expected rates tend to have the opposite effect.
How Market Participants Use Indicators
Different players in the financial ecosystem use economic indicators in different ways:
- Traders often position themselves ahead of major releases, betting on whether the actual figure will beat or miss consensus estimates, and react within seconds or minutes once the data is out.
- Portfolio managers use indicators to inform longer-term asset allocation decisions — for example, shifting toward defensive sectors when leading indicators suggest a slowdown is approaching.
- Central banks rely heavily on indicators like inflation, employment, and GDP growth to calibrate monetary policy.
- Corporations use economic data to inform hiring plans, capital expenditures, pricing strategies, and inventory management.
- Governments use these statistics to shape fiscal policy, including tax and spending decisions.
A Word of Caution
While economic indicators are indispensable tools, they come with limitations worth remembering. Data is often subject to revision after initial release, sometimes substantially, as more complete information becomes available. Indicators can also send conflicting signals. A strong labor market alongside slowing manufacturing activity, for instance. That requires careful interpretation rather than a simple up-or-down read. And no single indicator, however closely watched, tells the whole story on its own. Skilled analysts tend to synthesize multiple indicators. They weigh their relative timeliness and reliability, and consider the broader macroeconomic context before drawing conclusions.
Conclusion
Economic indicators serve as the vital signs of a nation’s economic health. Data points that, taken individually or together, help market participants understand where an economy has been. Where it currently stands, and where it may be headed. Whether it’s the monthly jobs report, a quarterly GDP release, or a central bank’s interest rate decision – these statistics carry the power to move markets in an instant precisely because they shape expectations about the future. For anyone seeking to understand financial markets — whether as an investor, a business leader, or simply an engaged citizen — developing fluency in reading and interpreting economic indicators is not just useful, but essential.


Add comment