

Trading With the Trend: How to Identify a Trend in Forex
Forex Trend Trading
“The trend is your friend” is one of the most quoted lines in trading — and one of the least applied correctly. Most traders don’t remember this phrase until after they’ve taken a losing counter-trend position and watched the market keep moving in the direction they bet against. By then, the lesson has already cost money.
The real skill isn’t knowing the saying — it’s building a repeatable process for identifying a trend early, confirming it with the right tools, and staying in it long enough to profit. That process matters more in currency trading than almost anywhere else.
Forex Trend Trading
Why Forex Trends Differently Than Other Markets
Currencies are unusually prone to sustained directional moves. Two forces are behind this:
- Macro drivers with long shelf lives. Interest rate cycles, trade balances, and central bank policy shifts don’t resolve in a day — they play out over months or years, which pushes exchange rates in one direction for extended stretches.
- Synchronized capital flows. Because forex is a 24-hour global market, news is absorbed by institutional and retail participants almost simultaneously, creating short, sharp intraday trends layered on top of the bigger macro trend.
This dual nature — long macro trends plus fast intraday trends — is exactly why traders need a structured way to confirm a trend exists before committing capital to it.
Step One: Define a Trend by Behavior, Not Just Direction
Saying “a trend is prices moving in one direction” is technically true and practically useless. A sharper working definition:
A trend is a repeatable price reaction at support and resistance levels that shift over time.
In an uptrend, pullbacks find buyers at rising support levels, and price keeps carving out new highs. In a downtrend, rallies keep getting sold at falling resistance levels, and price keeps making new lows. The moment that pattern breaks — support fails to hold, or resistance fails to cap price — is the moment the trend itself is in question.
This behavioral definition points directly to the first practical tool: trendline analysis.
Why Trendlines Still Work (Despite the Skeptics)
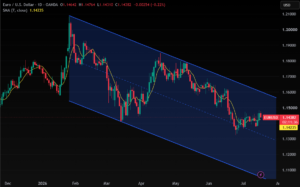
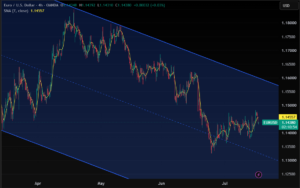
Trendlines get dismissed as subjective and after-the-fact. There’s some truth to that criticism — but it misses the point of what trendlines are actually for. Their job isn’t to predict the future with precision; it’s to filter out market noise so the underlying structure becomes visible.
If you plot a trendline and no clear structure emerges, that’s information too — it likely means no meaningful trend exists yet, and range-trading or standing aside may be the better approach.
A practical sequencing tip: start on higher timeframes first.
- Begin with daily or weekly charts to map the major, structurally important support and resistance levels.
- Then work down to 4-hour and hourly charts to identify shorter-term levels nested inside that bigger picture.
Working top-down like this prevents a common mistake: reacting to a minor trendline break on a short-term chart while ignoring a major long-term support or resistance level sitting just beyond it. The big-picture trend should always have the final say over the small-picture noise.
Forex Trend Trading
What Comes Next
Trendline analysis answers the question “is a trend here?” It doesn’t answer “should I trade it right now, and how do I protect the position?” That’s where a second layer of tools — momentum indicators, volatility measures, and disciplined trade management — comes in, and is worth covering as a next step once trend identification becomes second nature.
The bottom line: don’t wait for a losing counter-trend trade to remind you the trend was your friend all along. Build the habit of checking trend structure first, every time, before any trade idea gets serious consideration.
Step Two: Confirm the Trend With Momentum
Trendlines tell you where a trend should hold. They don’t tell you how much strength is actually behind it. That’s the job of momentum indicators, and two of the most widely used are the Moving Average Convergence Divergence (MACD) and the Relative Strength Index (RSI).
- MACD tracks the relationship between two moving averages of price. When the MACD line is rising and sits above its signal line, it supports the case that an uptrend has real momentum behind it — not just a temporary bounce off support. The reverse applies in a downtrend.
- RSI measures the speed and size of recent price moves on a 0–100 scale. In a healthy trend, RSI will often stay in an elevated range (roughly above 40–50 in an uptrend, or below 50–60 in a downtrend) rather than swinging wildly between overbought and oversold. A trend that keeps producing overbought or oversold readings without reversing is often a sign of strength, not exhaustion — a nuance that trips up traders who use RSI purely as a reversal signal.
Using a momentum indicator alongside trendline analysis creates a two-step filter: the trendline identifies where the structure is, and momentum confirms whether there’s enough underlying force to respect that structure.
Step Three: Respect Volatility When Sizing the Trade
Even a correctly identified trend can stop a trader out if the trade is sized without regard to how much the currency pair actually moves. This is where a volatility measure like Average True Range (ATR) earns its place in the process.
ATR calculates the average range a pair has moved over a set number of periods. Two practical uses:
- Stop placement. A stop set at a fixed number of pips regardless of volatility will be too tight in a fast-moving pair and unnecessarily wide in a quiet one. Basing the stop on a multiple of ATR (for example, 1.5x or 2x ATR) adapts the stop to current market conditions.
- Position sizing. Wider ATR means wider stops, which means smaller position size is needed to keep risk per trade consistent. This keeps a single trade from carrying outsized risk just because the pair happens to be more volatile that week.
Step Four: Manage the Trade, Not Just the Entry
Identifying a trend and entering with confirmation is only half the job. Trends end — sometimes gradually, sometimes abruptly — and a trade plan needs a way to protect profit as the trend matures.
A few approaches traders commonly use together:
- Trailing stops that move up (in an uptrend) as new higher support levels form, locking in gains without capping the upside if the trend continues.
- Partial profit-taking at predefined levels — such as prior swing highs/lows or round-number levels — while letting a portion of the position run with a trailing stop.
- Trendline breaks as an exit signal. The same trendline that confirmed the trend’s existence can also serve as the warning sign that it’s ending — a decisive break, especially on higher timeframes, is often treated as a cue to tighten stops or exit rather than wait for a full reversal to be confirmed.
Forex Trend Trading – Putting It Together
A complete trend-trading process looks less like a single indicator and more like a sequence of checks:
- Trendline analysis (top-down, weekly to hourly) to establish whether a trend exists and where its key levels sit.
- Momentum confirmation (MACD/RSI) to gauge whether the trend has real force behind it.
- Volatility-adjusted risk sizing (ATR) so stops and position size fit current market conditions.
- Active trade management (trailing stops, partial exits, trendline-break exits) to protect gains as the trend evolves.
None of these steps is complicated on its own. What separates traders who consistently catch trends from those who chase them after the fact is simply running through this sequence before placing a trade — not reaching for it only after a counter-trend position has already gone wrong.
Daily Tips


