

Trend Lines: Beyond the Basics
Trend Line Trading
Most traders know how to draw a trendline: connect two or more points on the chart — two lows for a support line, two highs for a resistance line — and you’re done.
That’s the easy part. What’s rarely spelled out are the rules around how a trendline behaves once it’s drawn, and a technique for putting old trendlines to work on future price action.
Trend Line Trading
Two Rules Nobody States Out Loud
Rule 1: Once a support trendline breaks, it becomes resistance. This is the concept of polarity — a line that once held price up now caps it from above (and the reverse is true for a broken resistance line, which becomes support). It sounds simple, but few traders build it explicitly into how they read a chart in real time.
Rule 2: A trendline can be penetrated without being broken. A single wick poking through a line doesn’t mean the trend is over. To actually declare a trendline “broken,” you need at least two consecutive bars closing beyond it — below a support line, or above a resistance line. This one rule alone filters out a huge amount of noise and false signals.
Trend Line Trading
From Theory to a Predictive Tool: The “Psychic” Trendline
Here’s where it gets useful.
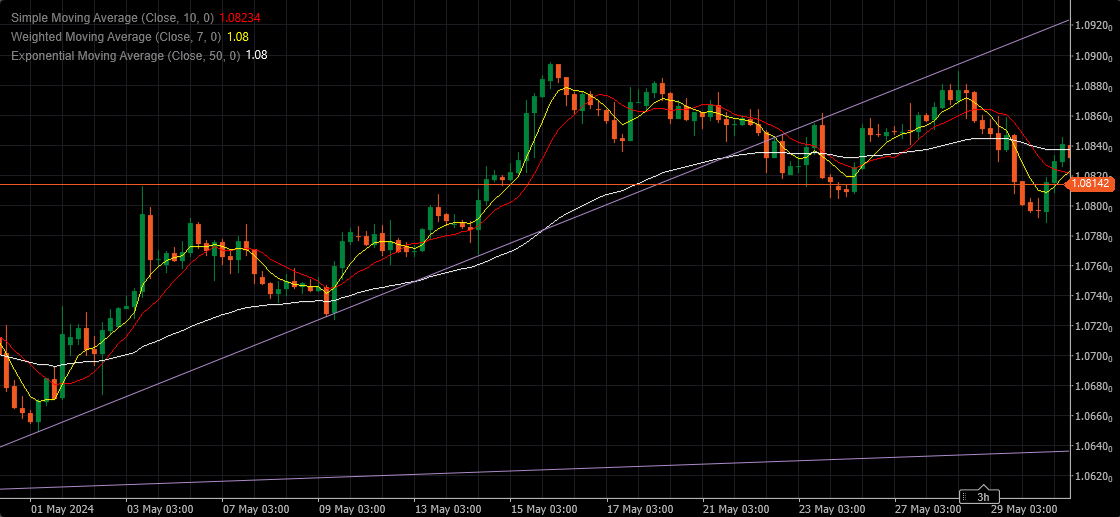
Look at a past chart. The trend and the tops and bottoms are obvious in hindsight — that’s not the interesting part. The interesting part is this: that support trendline didn’t just apply once.
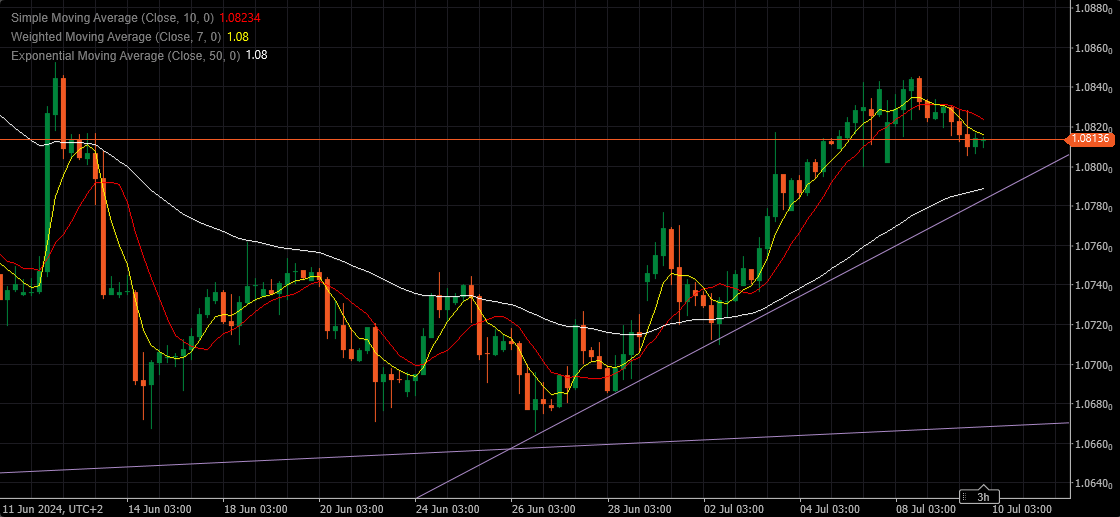
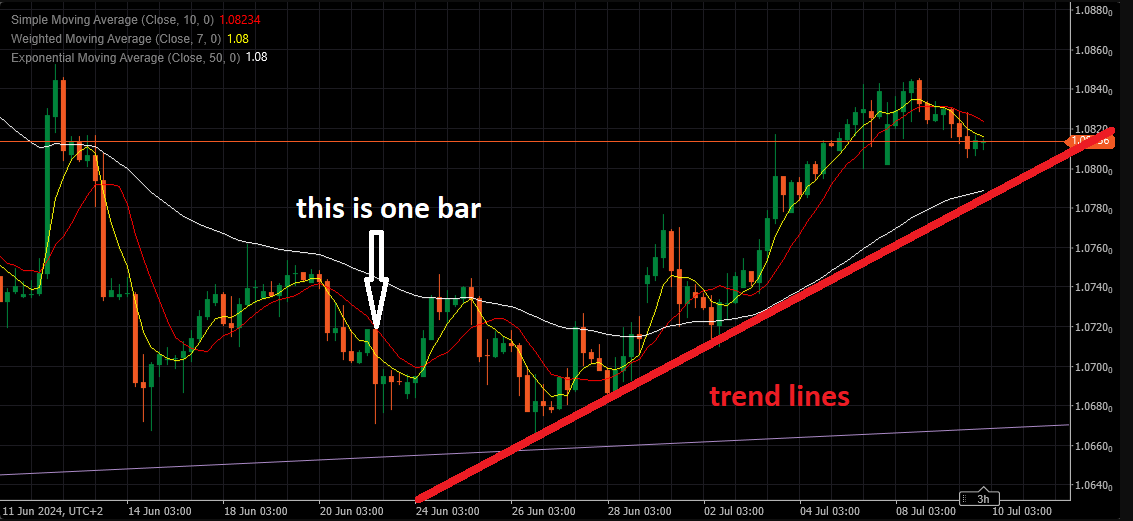
Take the exact same trendline — same angle, same slope — and clone it onto a different low, at a different point in time. If price respects it there too, you’ve found something more than a coincidence: a Psychic Trend Line.
How it works
- Find a trendline that worked well in the past — one that price respected cleanly over an extended move.
- Copy that line (angle and all) and place it on a new low, at the moment price leaves that low behind.
- Watch whether price respects the cloned angle going forward.
- Repeat every time a new low forms. If the same angle keeps fitting, you’re not redrawing a new line from scratch each time — you’re recognizing a recurring structural rhythm in how that instrument trends.
This isn’t a crystal ball. It’s pattern recognition: certain instruments tend to advance or decline at a fairly consistent slope, over and over, because the underlying flow of buying or selling pressure tends to move at a similar pace each time.
Why it matters
- Always under the same angle
- once you’ve identified the “true” angle for an instrument, you’re not guessing at new trendlines each cycle; you’re testing the market against a known template.
- An early warning system
- a cloned line gives you a support/resistance reference before enough new lows have formed to draw one organically.
- A cleaner read on where the market wants to move
- even when price doesn’t respect the line perfectly, seeing how it interacts with the cloned angle tells you something about momentum and character.
A Word of Caution
Two things are worth keeping in mind before treating this as gospel:
- Hindsight bias. It’s easy to find an angle that “fits” after you already know how price played out. The real test is whether a cloned line has predictive value going forward — placed on a new low before you know the outcome, not fitted retroactively.
- Anchor point selection. Cloning the angle is mechanical. Choosing where to re-anchor it (which low counts as “the” low) is subjective. That judgment call is doing more work than it might seem.
Used with those caveats in mind, this becomes less a trick and more a discipline. Instead of treating every new low as a blank slate, you’re asking whether the market is repeating a rhythm it’s shown you before.
Trend Line Trading
Add comment