

Why Tonight’s Close Matters More Than Today’s High
S&P 500 Record High. The S&P 500 has printed a new all-time high on the daily chart. That is the headline. The number I am watching is 7,765, because a settlement above it tonight is what turns a spike into a signal, and it calls for another new high after it.
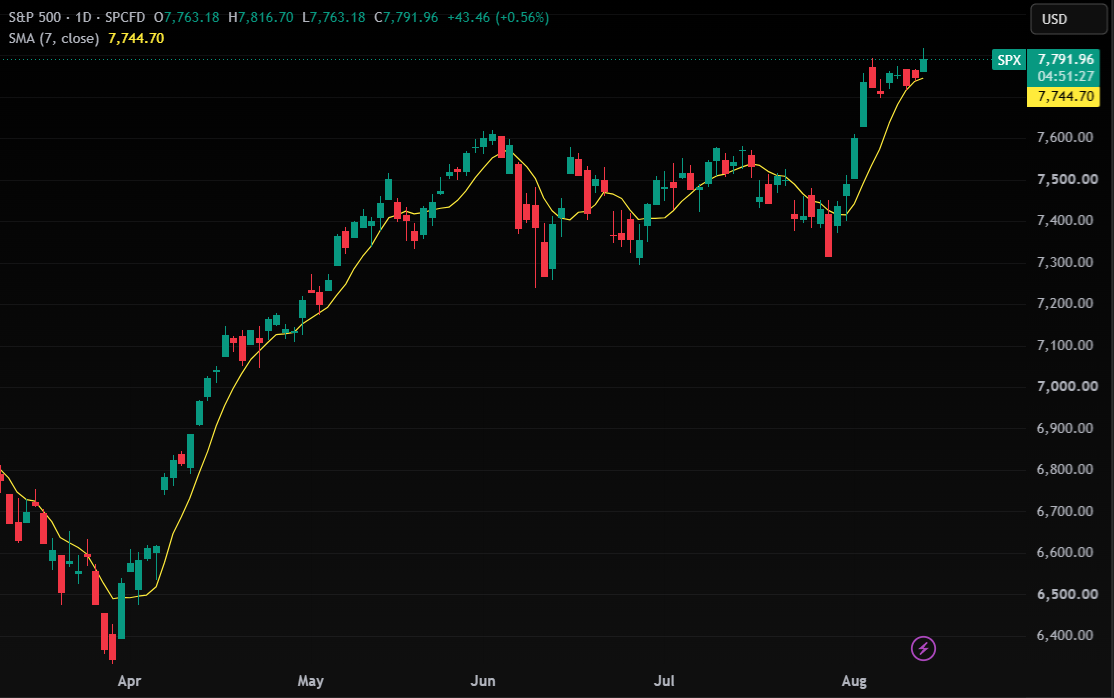
S&P 500 Record High – The facts behind the move
Two inflation prints landed inside twenty-four hours and both went the market’s way. July consumer prices rose a tenth of a percent on the month, putting the annual rate at 3.4%, with core at 2.5% — in line with what economists expected. Then wholesale prices did better than that: July PPI came in unchanged on the month against an expected rise of 0.2%.
Oil helped as well. Brent and WTI both shed around 2%, with US crude near $81, as traders weighed softer demand forecasts against the ongoing conflict and the closure of the Strait of Hormuz.
The rates picture moved with it. Two-year Treasury yields dropped six basis points to 4.14%, and money markets cut the odds of a September Federal Reserve hike to roughly 35% from about 50% earlier in the week. Note the direction of that sentence — in this cycle the risk being priced is a hike, not a cut, and every soft inflation number is being read as one more reason the Fed stays on hold.
For context on how persistent this advance has been: the index had already logged 25 record closes in 2026 by the end of last week, when it settled at 7,757.67. That came in the same week July payrolls contracted by 23,000 — the first negative print in over two years — and the market chose to read weak jobs as dovish for rates rather than bearish for growth.
Why 7,765
The record closing high stands at 7,757.67. The shelf of intraday resistance sits a little above it, around 7,772. A close at 7,765 or better puts the index above every closing price in its history and through the middle of that shelf on the day it absorbed two inflation reports without flinching.
That is the setup I want. An intraday high that gets sold back under the old record tells you sellers are still working the level. A close above it tells you they have stepped away, and the measured continuation from a confirmed breakout of a shelf this tight points to another new high in the sessions that follow. Below 7,748, the argument is off and this becomes a failed test, not a breakout.
Where the disagreement is
The bulls are leaning on breadth and earnings. Ryan Detrick at Carson has stayed constructive for the balance of 2026, arguing that <cite index=”71-1″>the advance–decline line reaching a record shows participation is broad rather than narrow</cite>, and he has been looking for further double-digit gains into year-end.
The cautious camp says the Fed is not the story. Glen Smith of GDS Wealth Management made the point after this morning’s data that <cite index=”61-1″>a single PPI reading does not change the Fed’s calculus, because the inflation problem now runs through the Middle East and the Strait of Hormuz rather than through monetary policy</cite> — and the Fed cannot influence either.
The seasonal bears have history on their side. <cite index=”72-1″>Bank of America’s work shows August through October has been the weakest three-month stretch of the year on average going back to 1928, though even in the negative years the typical drawdown has been around 7%</cite>.
And the technicians want confirmation, not one close. Katie Stockton at Fairlead has argued through this recovery that a breakout deserves a couple of decisive consecutive closes above resistance before anyone trusts the change in trend. That is a reasonable discipline, and it is not incompatible with what I am saying — it just means the second close is worth as much as the first.
Goldman Sachs sits somewhere in between. Their strategists have carried strong earnings forecasts for the year while flagging <cite index=”76-1″>sharp momentum and narrow breadth as cautionary signals</cite>, with the market multiple expected to stay flat near 21 times earnings rather than expand further.
What I take from it
Records are not a reason to buy and seasonality is not a reason to sell. Both are context. The tradeable question tonight is simple: does the index settle above 7,765 or does it get pushed back under the old record close?
If it settles above, the path of least resistance stays higher and I expect another new high to follow. If it fails there — particularly with a long upper wick and a close back under 7,748 — then the sellers defended the level, the two inflation prints were the best news this market was going to get, and August starts to look like the month the calendar says it usually is.
Levels first. Opinions second.
This article is educational and is not investment advice. Trading and investing carry a substantial risk of loss and are not suitable for every investor. Past performance is not indicative of future results.
- CNBC live market coverage: https://www.cnbc.com/2026/08/12/stock-market-today-live-updates.html
- Kiplinger on Wednesday’s CPI session: https://www.kiplinger.com/investing/stocks/s-and-p-500-rises-on-mild-inflation-data-red-hot-ai-rally-stock-market-today
- CNBC on the technicians’ confirmation level: https://www.cnbc.com/2026/08/04/sp-500-is-at-all-time-highs-but-technical-analysts-are-watching-this-key-level.html
Add comment