

EUR/USD: One Number Decides the Weekly Close
EUR/USD weekly close
The euro is sitting 17 pips below the level that matters, with one session left in the week and the July employment report landing in the middle of it.
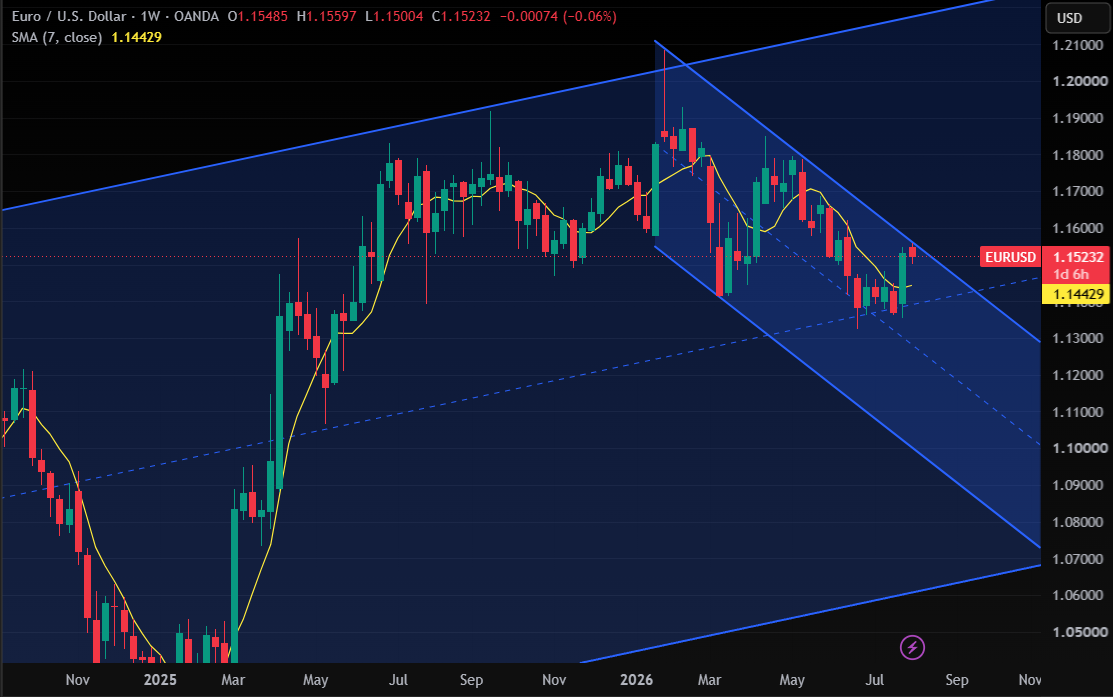
Spot is 1.1543. The ceiling is 1.1560. Support is 1.1450. That is a 110-pip box, and everything about where this pair trades into the middle of August is going to be settled inside it on Friday afternoon.
Why 1.1560 is the level
It is not just a horizontal that price has bounced off a few times. Take the swing from the 2026 high at 1.1915 down to the 24 June low at 1.1355 — 560 pips of decline. The 38.2% retracement of that leg sits at 1.1569.
That is the first Fibonacci shelf of the entire down move, and it explains why the recovery has stalled here rather than pushing through. Price is not meeting an arbitrary round number. It is meeting the first place where anyone who sold the 1.1915 high has a defensible reason to add.
Above it, the ladder continues: 1.1635 at the halfway mark, 1.1701 at 61.8%. Neither is in play this week, but they are what opens up if the shelf gives on a closing basis.
Why 1.1450 is a band, not a line
The move that got the pair here was the break above 1.1480, which completed a double bottom on the daily chart. That breakout level has not been retested.
So the downside is not a single price. It is a zone running from 1.1480 to 1.1450 — broken resistance stacked on top of horizontal support, with the daily reversal pattern’s validity riding on the lower edge. A weekly close beneath 1.1450 does not just take out support. It invalidates the structure that produced the entire rally.
The carry problem
Here is what euro longs are actually fighting. The Fed sits at 3.75%. The ECB sits at 2.40%. That is 135 basis points of negative carry for anyone holding the pair long.
Positions that cost you money to hold need a reason to exist, and the reason here is convergence rather than level. Eurozone Q2 GDP came in at 0.4%, the best reading since the start of 2025 and comfortably above expectations, which has pushed the odds of a September ECB hike higher. Meanwhile US labour data has been deteriorating — June payrolls printed 57,000 against a 110,000 consensus, and April and May were revised down by 74,000 combined.
Narrowing differential, euro up. That is the whole trade. It also means the trade is only as durable as the data flow that feeds it, which brings us to Friday.
What the print has to do
July payrolls are released Friday at 08:30 ET. Consensus is 80,000 against a prior of 57,000. Unemployment is expected unchanged at 4.2%, average hourly earnings unchanged at 3.5% year on year.
The forecast range is 40,000 to 157,000. That spread is unusually wide, and it tells you something useful before the number even prints: the desks do not have conviction. When the range is that open, the reaction function is wider than normal too.
Sub-60,000. The convergence story gets its confirmation. A weekly close above 1.1569 opens 1.1635 as the next objective. The complication is that this is the outcome the current price already reflects, which compresses the payoff on being right.
Near consensus. A spinning top at the 38.2% retracement. The range survives, nothing is resolved, and the pair goes into next week with the same two levels intact.
130,000 or better with unemployment steady. The Fed has no reason to move, carry reasserts itself, and 1.1480 to 1.1450 comes into play. ING is already looking for a move below 1.1500 on dollar recovery.
Two reasons not to trust Friday’s close
The first is what kind of close it will be. A weekly close through a Fibonacci level driven by a data release is the least reliable version of that signal. Event-driven closes are produced by positioning being flushed, not by trend flow arriving. The distinction matters because the follow-through is what pays, and event closes at technical levels get reversed the following Tuesday often enough that treating Friday’s print as confirmation is a mistake.
The second is the calendar. US CPI lands on 12 August, and the September FOMC is on the 16th. Whatever Friday establishes gets re-litigated four sessions later by a release with equal claim to moving the rate differential. Nothing decided this week is decided for long.
The geometry of the stops
Look at where the stops are. Shorts have theirs above 1.1560. Longs have theirs below 1.1450. Both clusters sit at the edges of a 110-pip box, and a high-volatility release is about to hit the middle of it.
That configuration has a familiar habit: the first move takes out one cluster, and the real move goes the other way. It is not a prediction, it is an observation about where the fuel is sitting. Which is why the useful discipline this week is closing prices rather than touches, and why a stop placed exactly at 1.1450 or exactly at 1.1570 is a stop placed where the market can most easily find it.
What would actually confirm
For the bull case: a weekly close above 1.1569, followed by a Monday and Tuesday that hold above it. The pullback that follows should find buyers before 1.1500. Anything that closes above the shelf on Friday and is back beneath it by Wednesday was a stop run.
For the bear case: a weekly close under 1.1450, which unwinds the double bottom and puts 1.1355 back on the table.
Between those two, there is no trade — only a range, a wide forecast distribution, and a calendar that gets busier from here.
Levels current as of 6 August 2026. This is market analysis, not a recommendation.
Add comment